In ZoneVu, you can display Seismic data, Horizons, and Fault surfaces in the 3D and 2D Viewers. This article details how to control the display and display properties of all loaded Seismic datasets.
3D Viewer:
ZoneVu supports the display of seismic Inlines, Crosslines, Depth Slices, and a Seismic Curtain in the 3D Viewer
Displaying Seismic Data:
Open Scene Control
Select the Seismic tab
Select the "Wellbore Line" checkbox to display the Wellbore Curtain
ZoneVu Uses the Well Plan and/or the Actual Deviation Survey to draw an arbitrary line through the 3D Seismic Volume. This line is used to sample the Seismic data and construct a Wellbore Curtain, which displays the seismic data that the wellbore is actually encountering not just the nearest Inline or Crossline. This Wellbore Curtain is flattened and used as the seismic display in the 2D Viewer (How does the Seismic Curtain work in ZoneVu?)
Use the "Inline", "Xline", and/or "Slice" checkboxes to turn on an inline, crossline, or depth slice
There are two ways to adjust which Inline, Crossline, or Depth Slice is being displayed in the 3D Viewer
In Scene Control, type in the desired inline or Crossline number, or slice depth (elevation)
Holding the "Crtl" + clicking & dragging on a seismic pane will allow you to slide that pane to another location
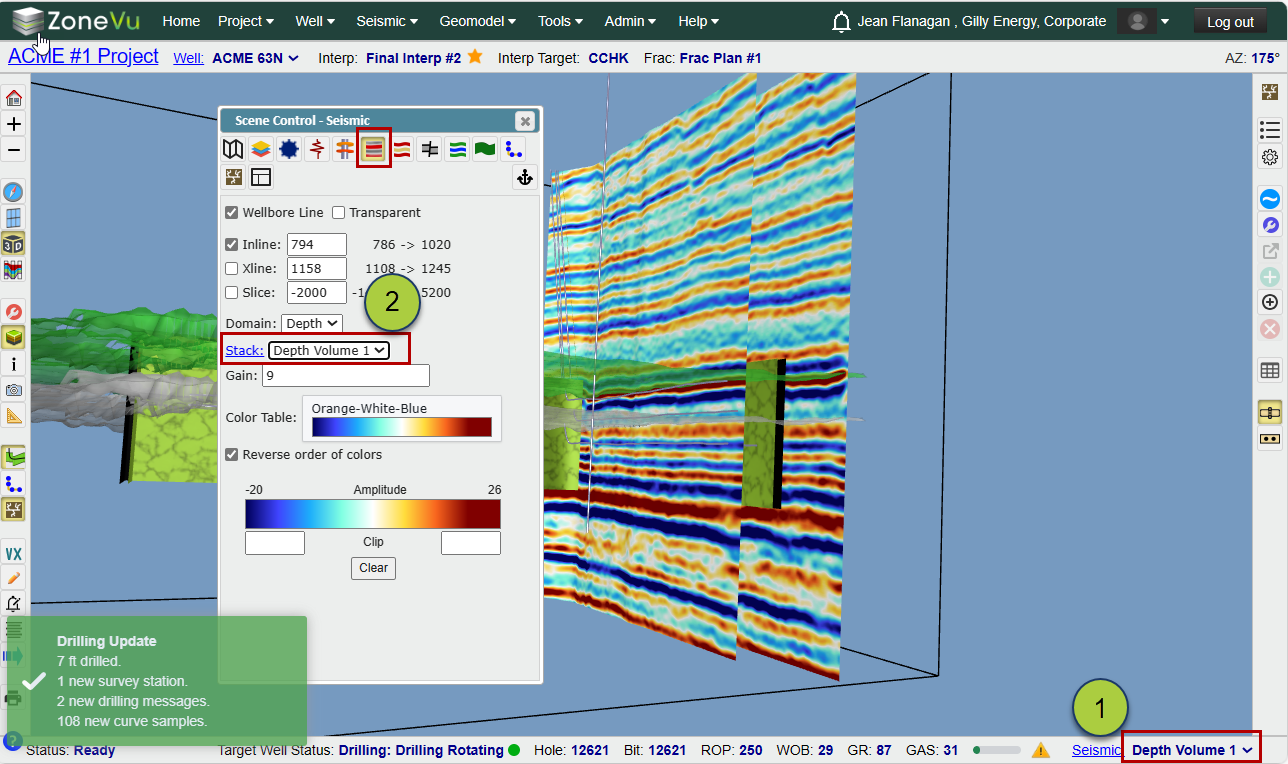
Changing between Seismic Volumes:
To change between different seismic volumes, either use the Seismic Dropdown in the bottom right corner...
...Or, use the "Stack" dropdown in Scene Control under the "Seismic" tab
Changing the Seismic Display Settings
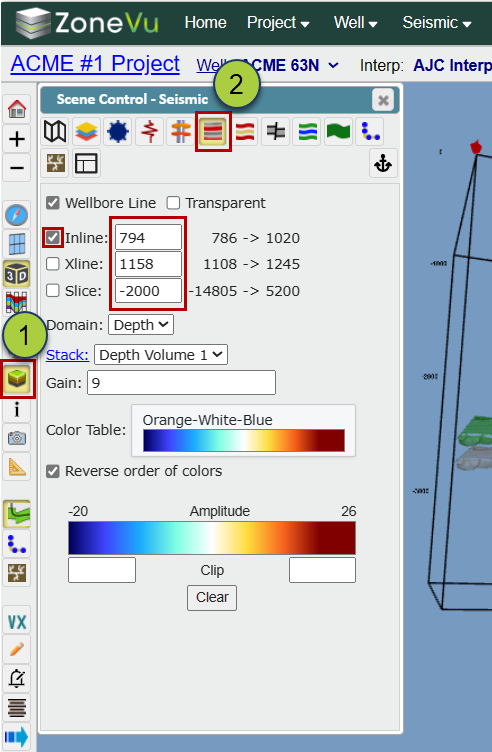
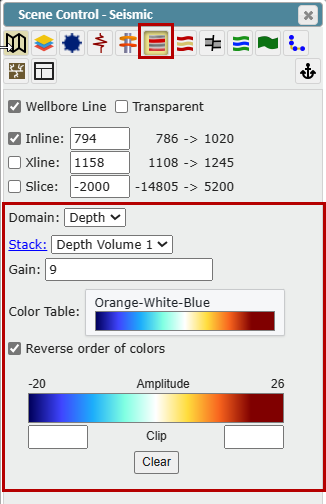
Open Scene Control
Select the Seismic Tab
Adjust the display settings
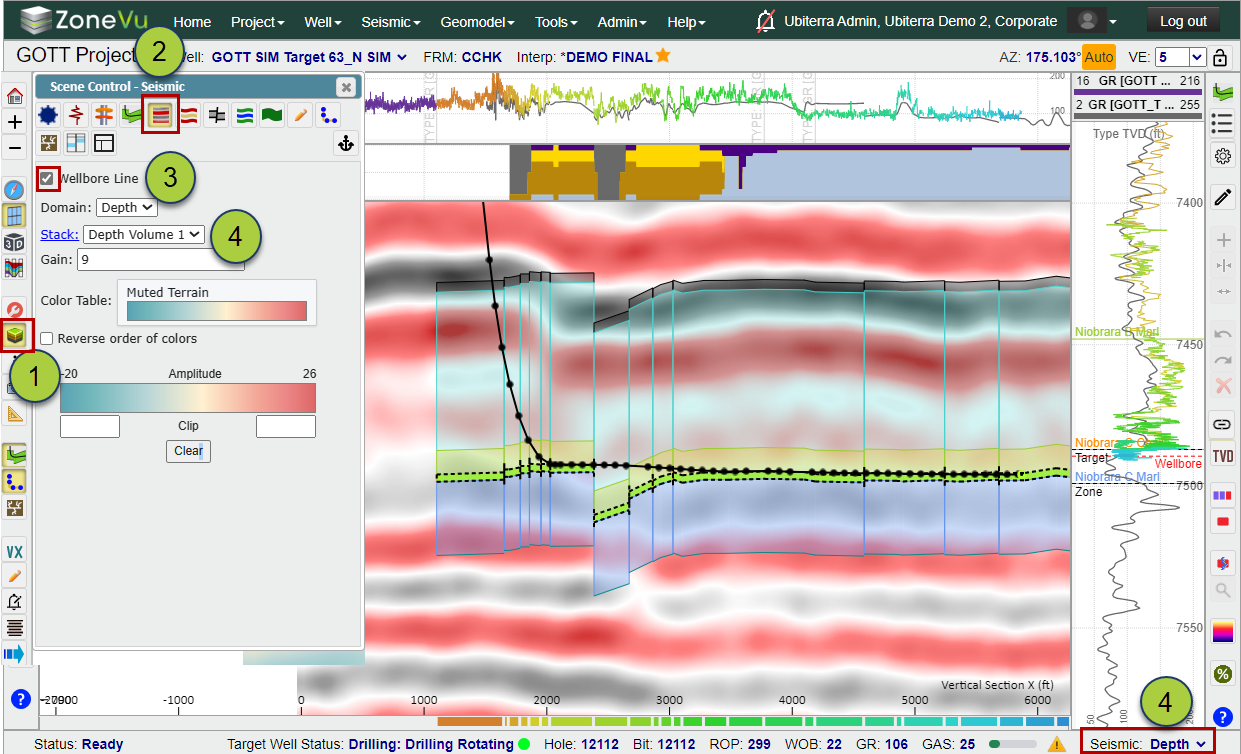
Domain: Toggles between Time and Depth volumes
Note: ZoneVu only supports the display of 3D Depth Volumes in the Viewers
Stack: Select which Seismic Volume you want displayed
Gain: Adjusts the gain used to display the seismic
Color Table: Choose which color bar is used for the Seismic Display (ZoneVu Color Spectrums)
Amplitude Min/Max: Displays the selected Color Bar, auto-calculated Min/Max, user-defined Min/Max clip values
Displaying Seismic Horizons:
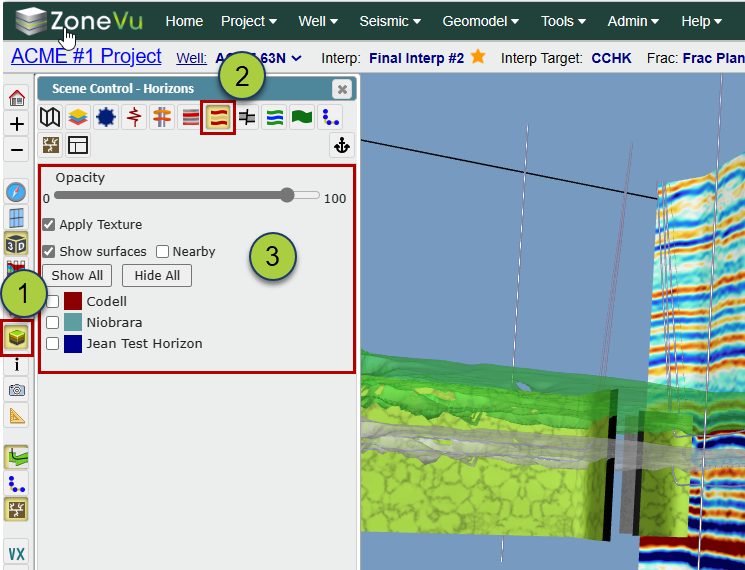
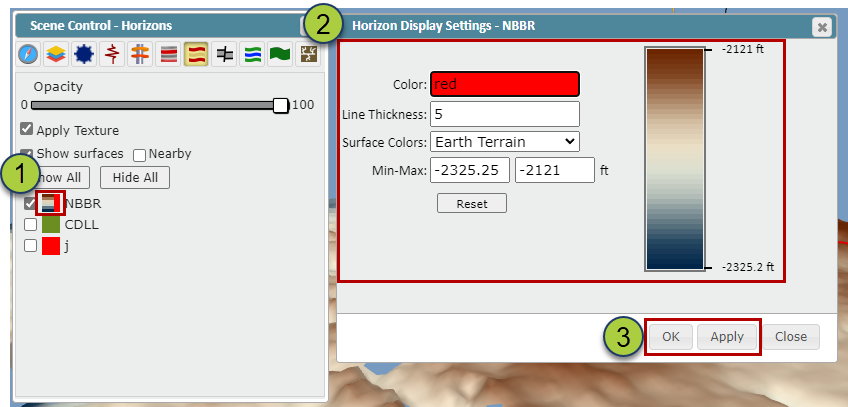
Open Scene Control
Select the "Horizons" tab
Use the checkbox to display a Horizon
Opacity Slider: Controls the opacity of the Horizon
"Apply Texture" checkbox: Applies a texture to the Horizon. If unchecked, the Horizon will have a shiny appearance
"Show Surface" checkbox: Toggles the visibility of the Horizon. If unchecked, only the Wellbore intersection line will be displayed
"Nearby" checkbox: If selected, the Horizon will only be displayed right next to the Target Well
"Show All" button: Turns on all available Horizons
"Hide All" button: Turns off all Horizons

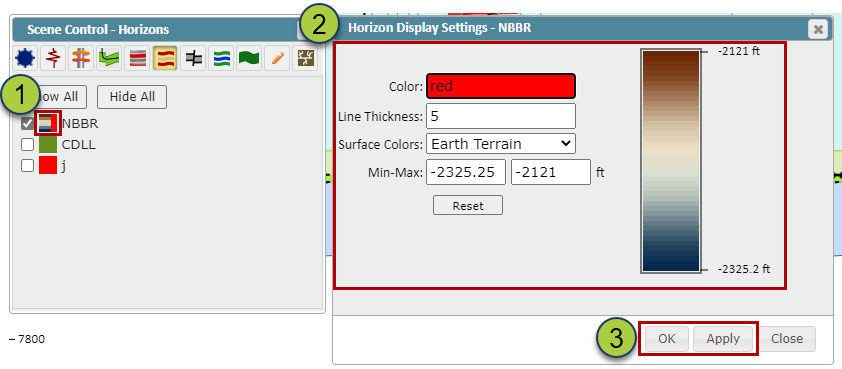
To change the Display Settings of a Horizon, click on the color square next to the Horizon name
Change the Color settings for the Horizon
Color: Change the reference color for this Horizon. This will be the color used for the Wellbore Intersection Line used in the 3D and 2D Viewers
Line Thickness: Controls how thick the Wellbore Intersection Line will be in the 2D Viewer
Surface Colors dropdown: Select the style/Color Bar used for the Surface coloring (not used in the 2D Viewer)
Min-Max inputs: Allows you to control the Min/Max values for the Color Bar scaling
"Rest" button: Rests the Min/Max values to the range of the dataset
Click the "OK" or "Apply" button to apply the changes
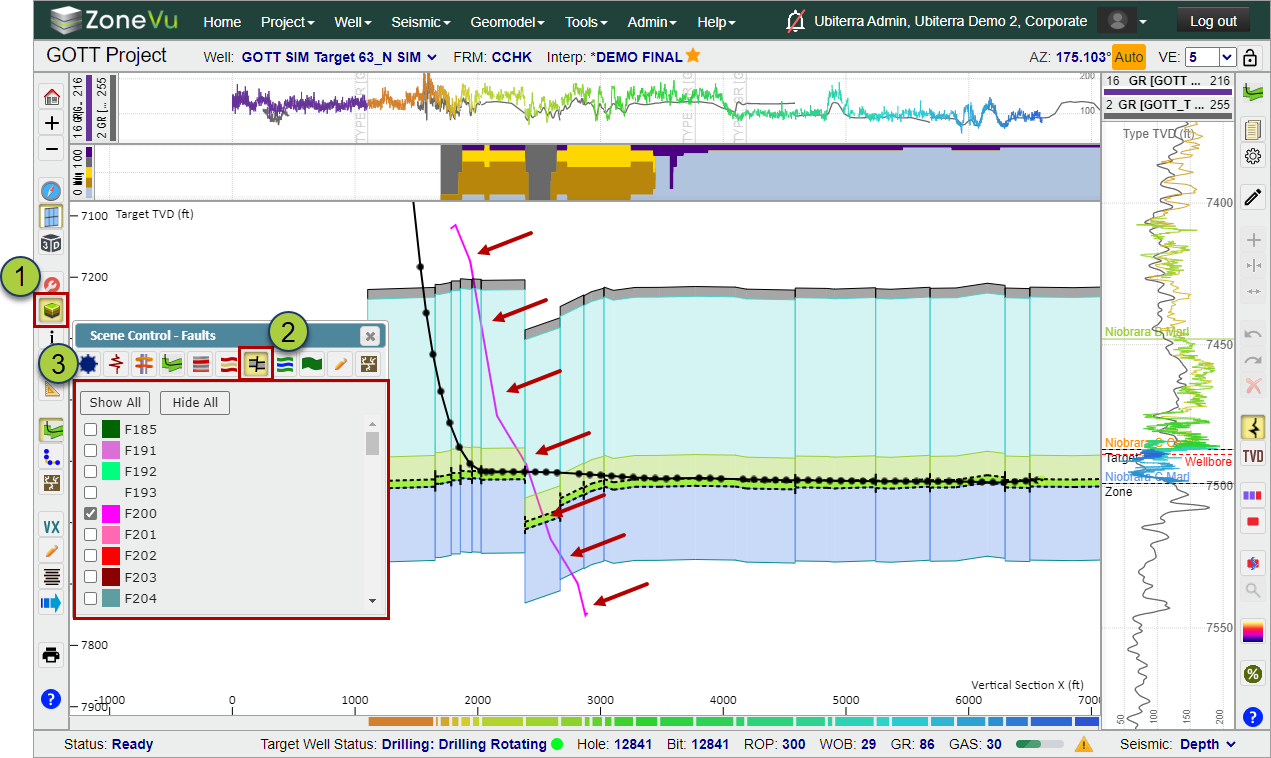
Displaying Seismic Faults:
Open Scene Control
Select the "Faults" tab
Use the checkbox to display a Fault
Opacity Slider: Controls the opacity of the Faults
"Apply Texture" checkbox: Controls if a texture is applied to the Fault Surface. If checked off the Fault Surface will have a shiny appearance
"Show Surface" checkbox: Toggle the visibility of the Fault Surfaces. If checked off only the Wellbore intersection line will be displayed
"Show All" button: Turns on all available Faults
"Hide All" button: Turns off all Faults
"Wellbore" button: Turns off all Faults intersecting the Target Well
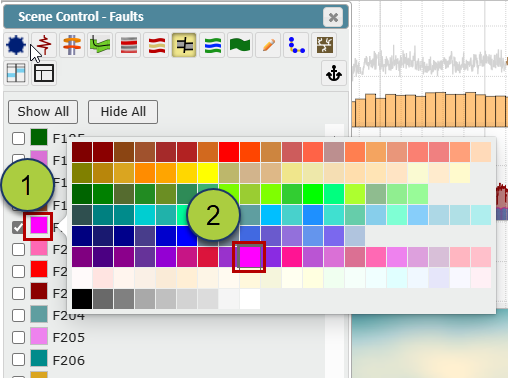
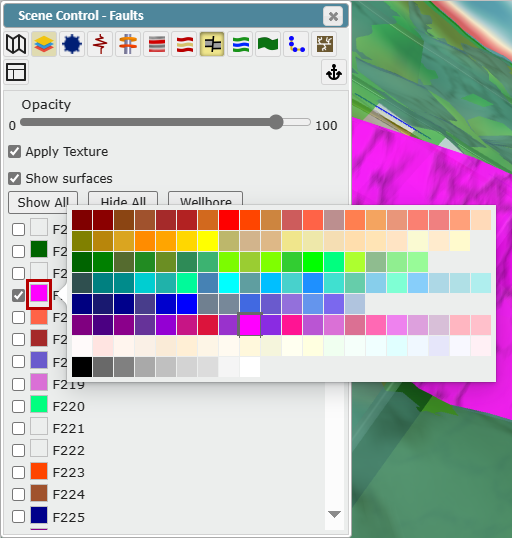
To change the Display Settings of a Fault Surface, click on the color square next to the Fault name
Click a square on the Color Selector to choose the Fault Surface's new color
2D Viewer:
Open Scene Control
Select the Seismic tab
Check the "Wellbore Line" checkbox to display the Wellbore Curtain
ZoneVu Uses the Well Plan and/or the Actual Deviation Survey to draw an arbitrary line through the 3D Seismic Volume. This line is used to sample the Seismic data and construct a Wellbore Curtain, which displays the seismic data that the wellbore is actually encountering, not just the nearest Inline or Crossline. This Wellbore Curtain is flattened and used as the seismic display in the 2D Viewer (How does the Seismic Curtain work in ZoneVu?)
To change between different seismic volumes, use the Version Dropdown. Alternatively, you can use the Seismic Dropdown in the bottom right corner
Additional Seismic Display Settings
Domain dropdown: Toggles between Time and Depth volumes
Note: ZoneVu only supports the display of 3D Depth Volumes in the Viewers
Gain: Adjusts the gain of the displayed seismic
Color Table dropdown: Choose which color bar is used for the Seismic Display (ZoneVu Color Spectrums)
Amplitude Min/Max: Displays the selected Color Bar, auto-calculated Min/Max, and user-defined Min/Max clip values
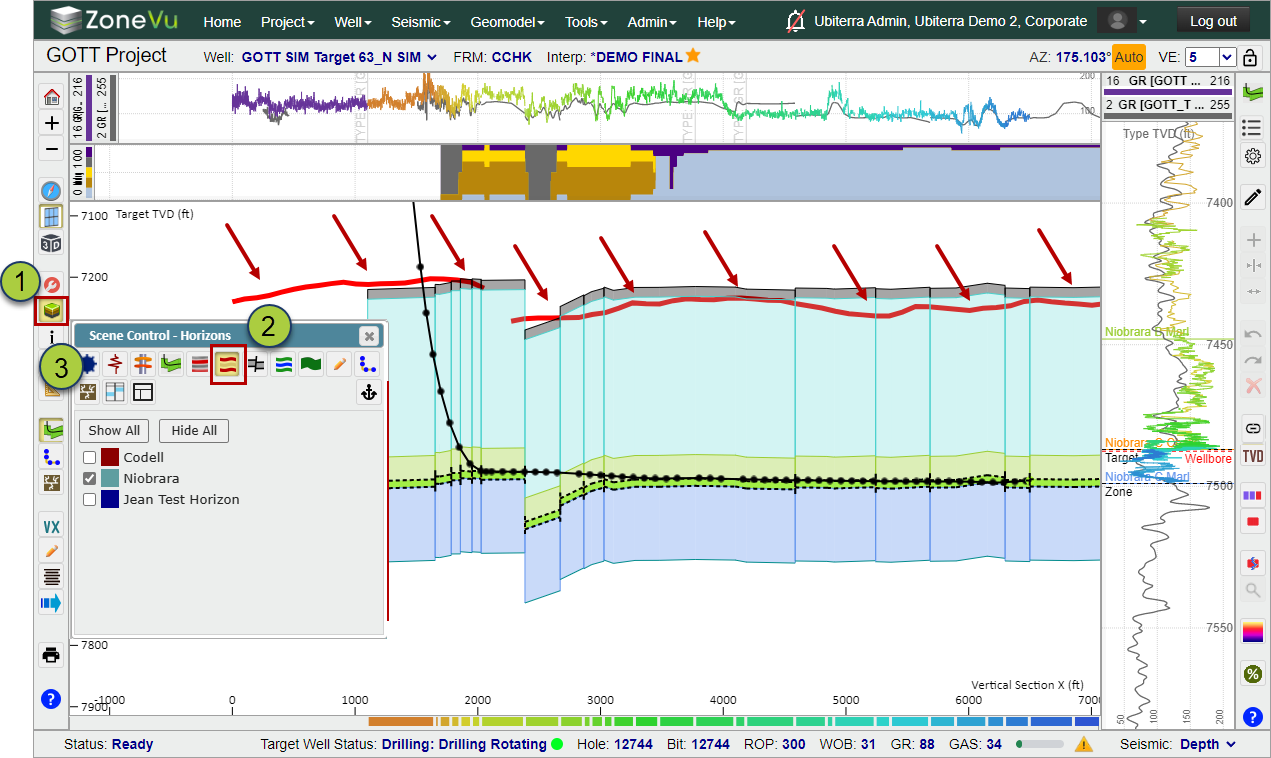
Displaying Seismic Horizons:
Open Scene Control
Select the "Horizons" tab
Use the checkbox to display a Horizon. In the 2D Viewer, Horizons are displayed as lines where the Wellbore intersects the Horizons
"Show All" button: Turns on all available Horizons
"Hide All" button: Turns off all Horizons
To change the Display Settings of a Horizon, click on the color square next to the Horizon name
Change the Color settings for the Horizon
Color: Change the reference color for this Horizon. This will be the color used for the Wellbore intersection line used in the 3D and 2D Viewers
Line Thickness: Controls how thick the Wellbore Intersection line will be in the 2D Viewer
Surface Colors dropdown: Select the style/Color Bar used for the Surface coloring, this is not used in the 2D Viewer
Min-Max inputs: Allows you to control the Min/Max values for the Color Bar scaling
"Rest" button: Rests the Min/Max values to the range of the dataset
Click the "OK" or "Apply" button to apply the changes
Open Scene Control
Select the "Faults" tab
Use the checkbox to display a Fault. In the 2D Viewer, Faults are displayed as lines where the Wellbore intersects the Faults
"Show All" button: Turns on all available Faults
"Hide All" button: Turns off all Faults
To change the Display Settings of a Fault Surface, click on the color square next to the Fault name
Click a square on the Color Selector to choose the Fault Surface's new color
Displaying Seismic Faults: