The Log Curve Histogram tool allows the User to sample any Log Curve in a Vertical or Horizontal Log track and create a histogram plot. The Depth, Scale, Data Type, and Style can all be controlled from the "Histogram" tab in the Log Display Settings dialog box.
Displaying a Log Curve Histogram:
Open the Log Display Settings dialog box
Note: The simplest way is to click on the Log header. A right-click & Scene Control access point also exists: Working with logs in the 2D Viewer
Select the "Histogram" tab
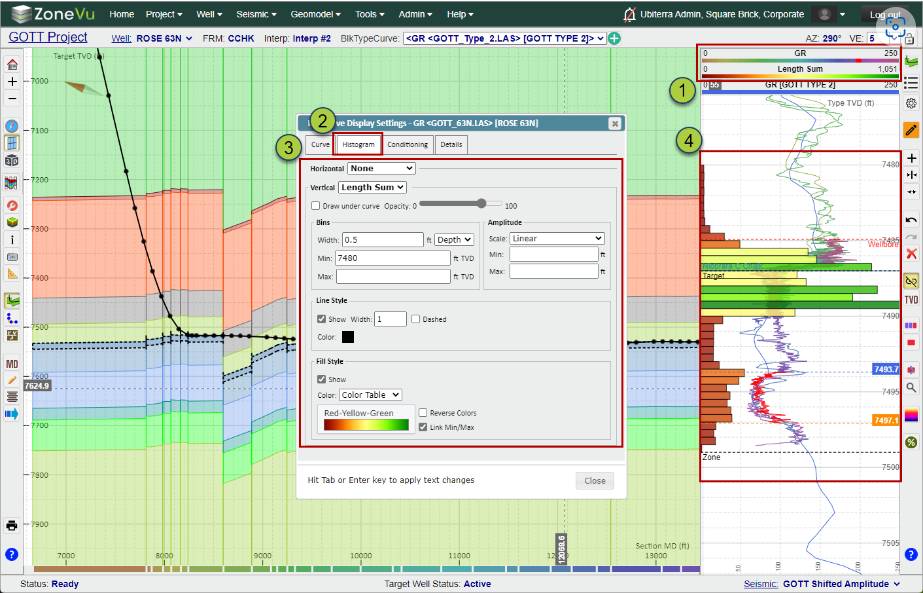
Use the "Vertical" and/or "Horizontal" dropdowns to select a histogram dataset to display in the related Log Track
Note: the Histogram Log Header will be displayed below the Log Curve Header (Image)
Use the display controls to customize the Histogram display
The Log Curve Histograms will be plotted in the same Log Track as the Log Curve
Histogram Options:
Count: Counts the number of samples in each Histogram Bar Length
Length Sum: Sums up the Total Wellbore length in each Histogram Bar Length
Sum: Sums all of the Log Curve data in the Histogram Bar Length
Average: Calculates the Average Curve Data in the Histogram Bar Length
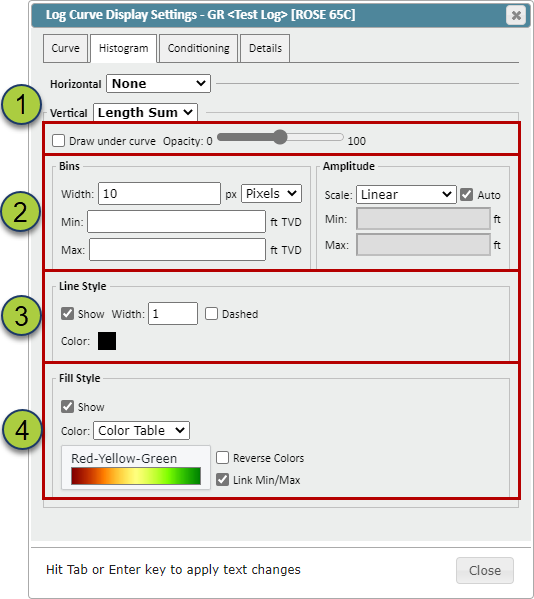
Histogram Display Options:
Curve Display Options
"Draw Under Curve" checkbox: Will render the Histograms under the related Log Curve if applicable
Note: Log Header rendering order honored when Histograms are displayed
Opacity Slider: Controls the opacity of the Histograms
Sampling and Scale Control
Histogram Bin Width Input (Pixel or Depth):
Note: Default is 10 Pixels
Min/Max Inputs (TVD or TVT): defined by the Vertical Log Track Scale
Note: When the Vertical Log Track is switched between TVD and TVT the inputs will be auto-recalculated
Amplitude Control:
"Scale" dropdown: Toggle between Linear and Log scale
"Auto" checkbox: When checked on, ZoneVu will auto-calculate the scale so the Max data value is set as the scale Max
Min/Max Input: Allows the users to set a desired Min/Max.
Note: If no inputs are provided the largest Histogram value will be used as the Max
Histogram Line Style: Control the Line Style of the Histograms
"Show" checkbox: Toggles the Histogram outlines On/Off
"Width" checkbox: Sets the line width; set to '1' by default
"Dashed" checkbox: Changes the outlines to a dashed line
Color Selector: Click on the color square to change the Line Color
Histogram Fill Style: Control the Fill Style of the Histograms
"Show" checkbox: Toggles the Histogram color fill On/Off
"Color Style" dropdown: Choose between "Single Color" and "Color Table"
Color Table selector: Shows the current Color Table. Clicking this button will open up the Color Table Options dialog box
"Reverse colors" checkbox: Reverses the selected Color Table
"Link Min/Max" checkbox: Links the Color Table scale to the Histogram scale. If unchecked the Histogram scale can be set independently of the Histogram scale