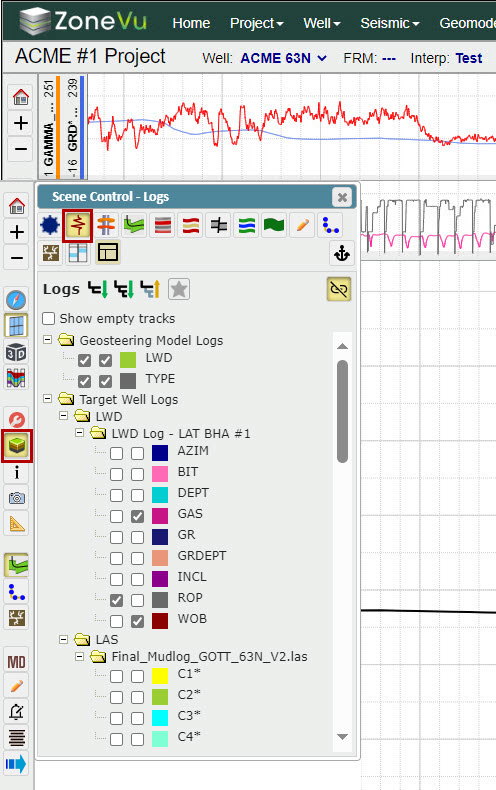
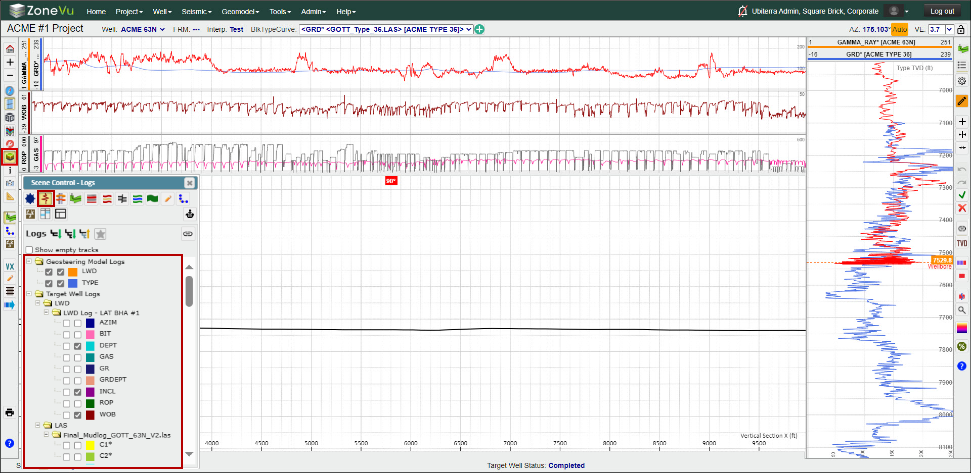
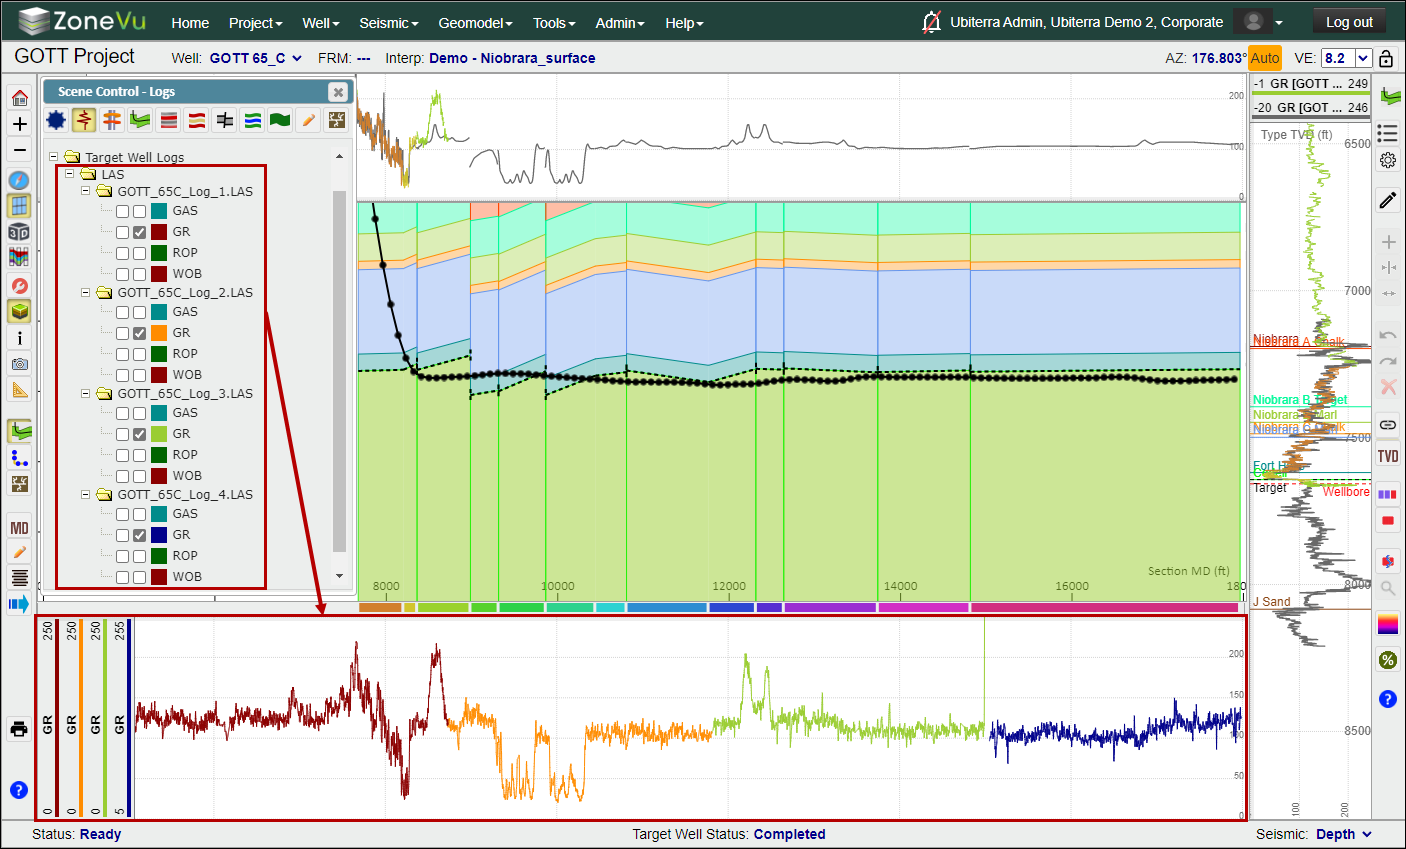
All available logs are located in Scene Control under the "Logs" tab
What are the different types of logs in ZoneVu?
Geosteering Logs: Selected Logs to geosteer with
LWD Log: Assigned log from the Target Well (Active Well) that is used to geosteer. You can assign more than one log and switch between them as you geosteer
Type Log: Assigned log from the Type Well that the Target Well is steered against. You can assign more than one log or Well, and switch between them as you geosteer Adding Multiple Type Logs to a Geosteering Interpretation
Type Well Logs: List of all logs associated with the defined Type Well(s). Type Wells are defined by assigning Type Logs to a Geosteering Interpretation
Target Well Logs: List of all logs associated with the selected Target Well (Active Well)
LAS: LAS files that have been manually loaded
LWD: LAS file created by RigStream
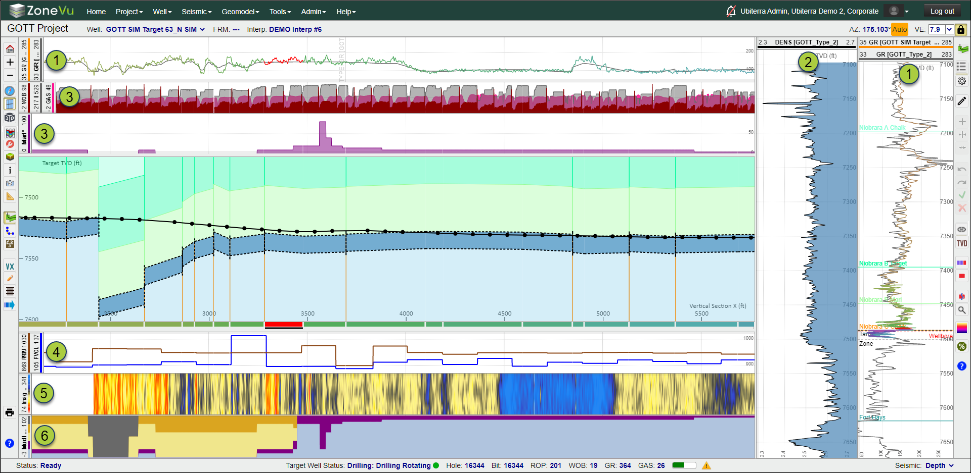
Modeled Logs: Synthetic logs associated with the Type Well(s) displayed in a Horizontal Track. These synthetic logs are calculated by using the Geosteering Interpretation to predict where the wellbore intersects the Type Well and using these values to build the synthetic log
Completions Logs: LAS files generated from data added to the Frac Table (input, import, download)
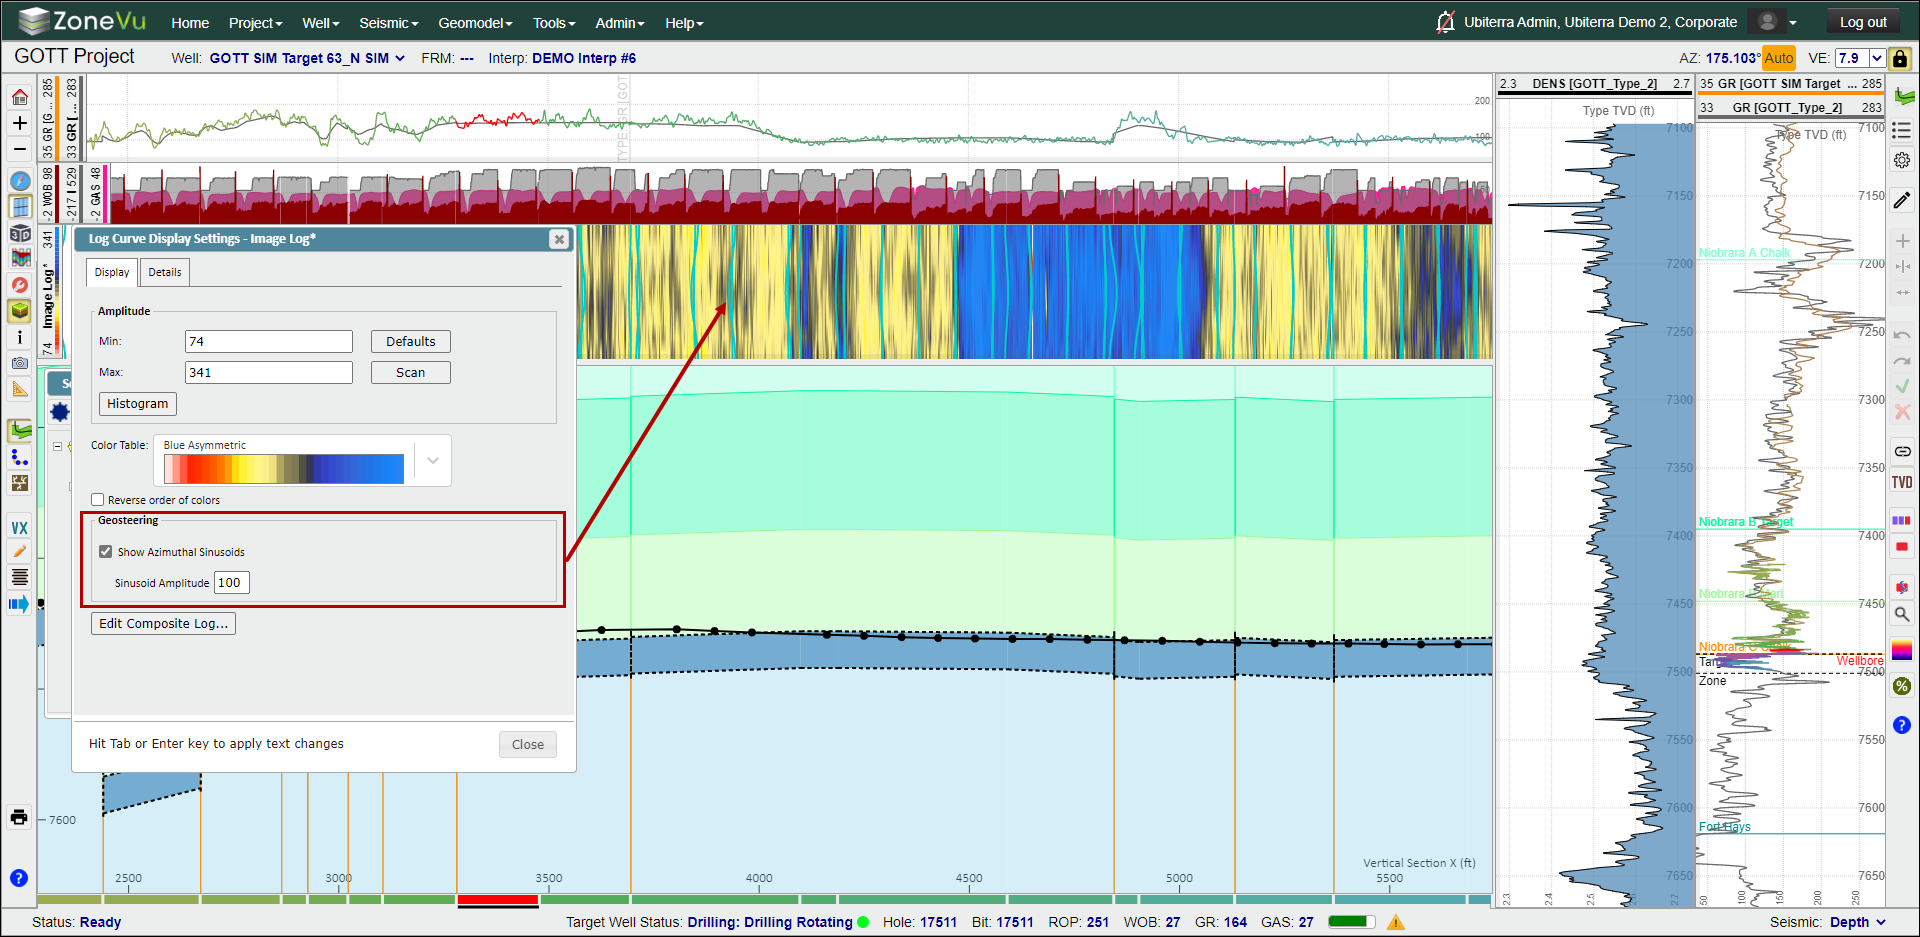
Image Logs: Azimuthal gamma-ray data stacked/spliced to produce an "Image" of the wellbore How to load and view Azimuthal GR data
Litho Logs: Stacked histogram display of multiple logs. Usually lithology information Importing and Displaying Mudlog Data
How to display a log in the Vertical/Horizontal Tracks:
First, open up Scene Control, select the "Logs" tab and scroll down to find the log you want to display. Use one or both checkboxes next to the log name to display the log, or grab the log name in the Scene Control and drag-&-drop the log into the desired Log Track
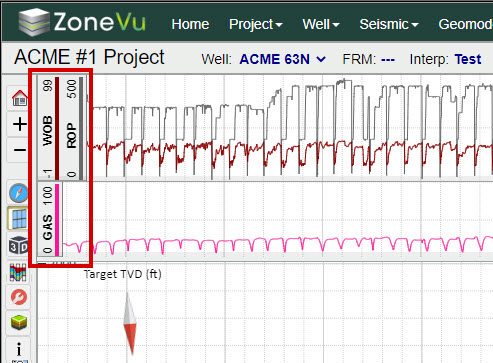
The left checkbox displays the log in a Vertical Track
The right checkbox displays the log in a Horizontal Track
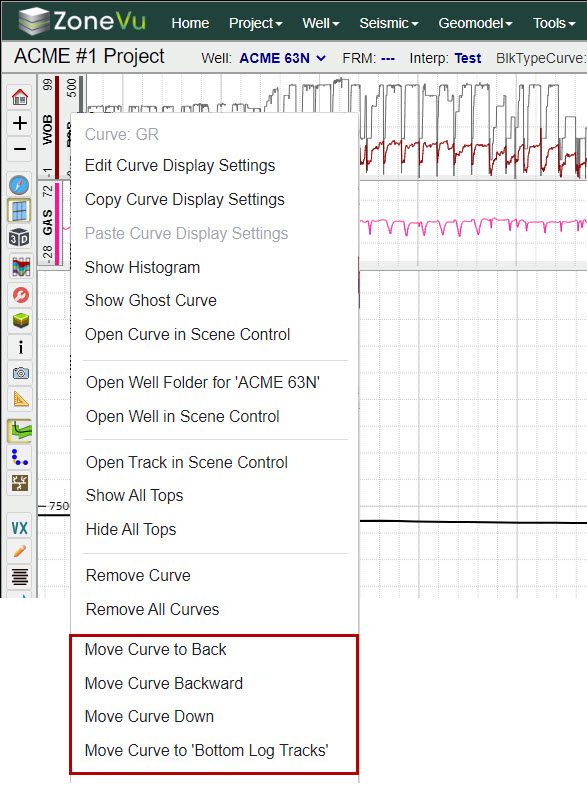
How to move logs around the 2D Viewer:
Logs can be displayed on any side of the Cross-Section (above, below, right, or left). By default, ZoneVu will place a new Vertical Log on the lefthand side and a new Horizontal Log below the Cross-Section. Also, when more than one log is placed in the same Log Track, you can choose which log is rendered atop the other(s) using the right-click option.
There are two ways you can move a log around the Viewer:
1. Grab the Log header and drag & drop it into another track or drop it on the Cross-Section to create a new log track
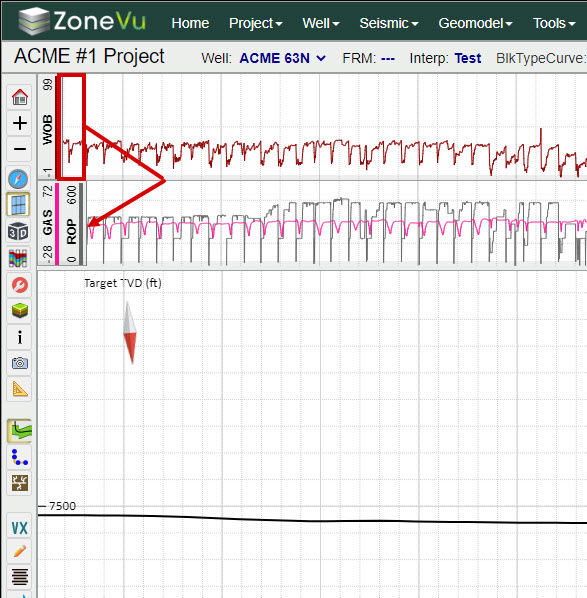
2. Right-click on the log header and select one of the options:
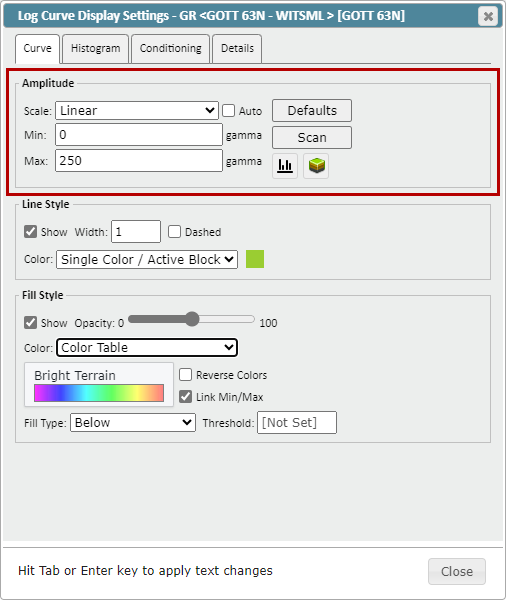
Changing a log scale:
There are two places you can change a Log's scale (3 for LWD & Type Logs)
On the Log Header in a Vertical or Horizontal Track
In the Log Curve Display Settings
For LWD & Type Log, you can also change their settings in the Geosteering Interpretation Settings pop-up under the "LWD" or "Type" tabs
To adjust the Log scale in the track header you can place your mouse:
In the center of the track header and roll your mouse wheel up/down. This will expand or contract the Min/Max Log Scale
Over the Min Log Value and roll your mouse wheel up/down. This will freeze the Min Log Value and change the Max Log Value
Over the Max Log Value and roll your mouse wheel up/down. This will freeze the Max Log Value and change the Min Log Value
Over the center of the log track and click drag up/down or right/left depending on if you are in the Vertical or Horizontal Track. This will bulk shift the Log Scale either higher or lower while maintaining the Log Scale range
To adjust the Log scale in the Log Curve display settings either:
Click on the Log Header in a Vertical or Horizontal Track
Right-click on a Log Header and select "Edit Curve Display Settings"
Click on the color box next to the log name in Scene Control
Right-click on the log name in Scene Control and select "Edit Curve Display Settings"
From here you can change the log scale (Linear or Logarithmic), input Min/Max Values, apply ZoneVu defaults (if applicable), or have ZoneVu scan the log and calculate the best min/max based on the data range. You can also view a histogram plot of the Log Values by clicking the "Histogram" button
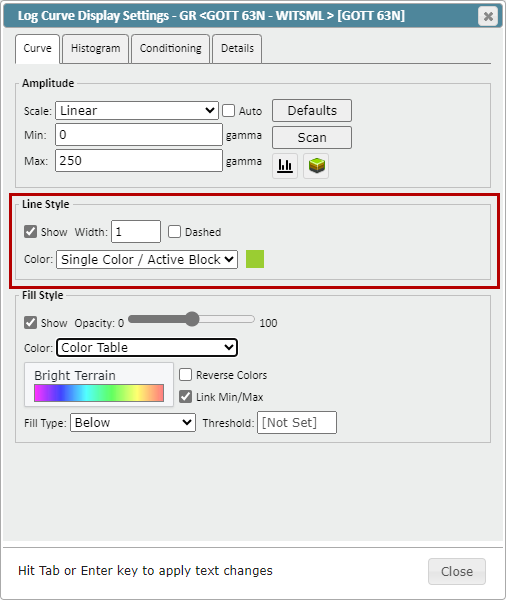
Changing a log's line style:
To adjust the Log Display parameters, go to the Log Curve Display Setting.
From here you can change the Line Style (color, Color Type: solid color/Geosteer/Single Color with Active block, width, dashing)
Note: 'Geosteer Block' color style will color the line/fill by the Geosteering Block color. Single Color / Active Block will color the log a single color but show the active segment as Red.
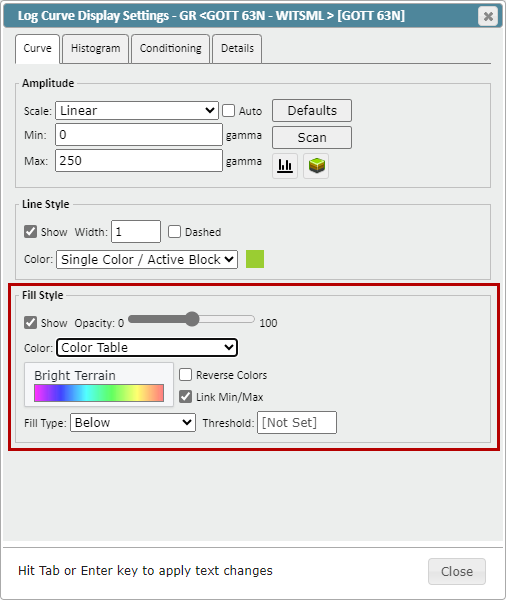
Changing a log's fill style:
To adjust the Log Display parameters, go to the Log Curve Display Setting.
From here you can change the fill style (on/off, color, Color Type: solid color/Geosteer/Color Table, opacity, fill above/below, & set a fill threshold).
Note: 'Geosteer Block' color style will color the line/fill by the Geosteering Block color. Color Table style will fill based on the log's amplitude values.
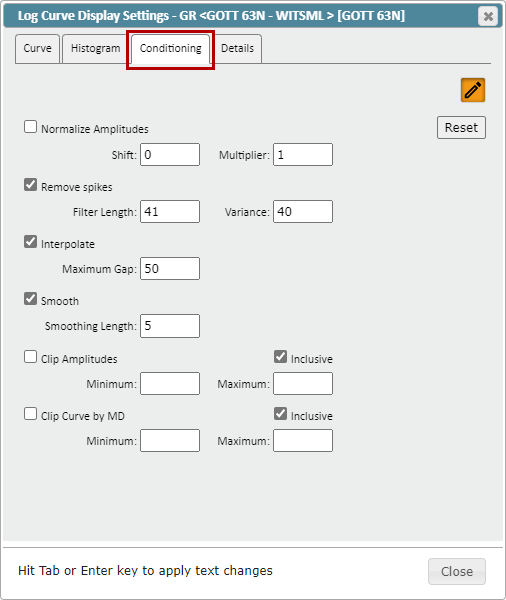
Applying Conditioning Parameters: Log Curve Conditioning
To adjust the Log Conditioning parameters, go to the "Conditioning" tab in the Log Curve Display Settings:
Here you can de-spike, interpolate (gap-fill), smooth, clip by amplitude, and/or clip by curve MD. For LWD and Type Curves, you can also Normalize the Amplitudes (Shift and Multiplier)
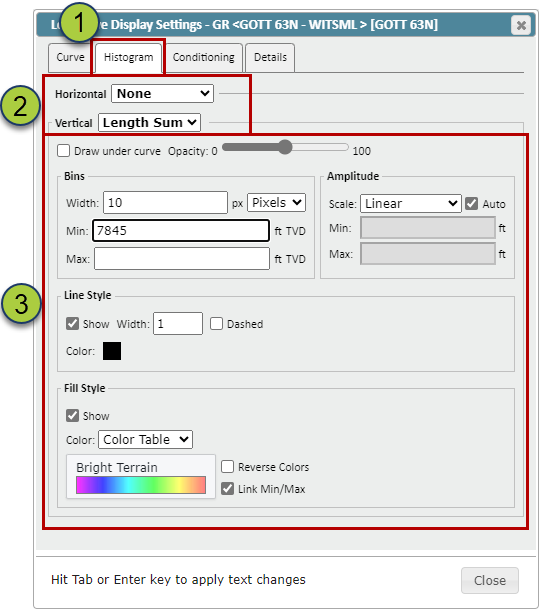
Applying conditioning parameters: Log Curve Histogram Tool
To adjust the Log Conditioning parameters, go to the "Conditioning" tab in the Log Curve Display Settings
You can choose different Histogram Plots for the Vertical and Horizontal Log Tracks
You can control the Opacity, Rendering Order, Bid with (Pixel or Depth), Amplitude Range, Line and Fill Styling
How to create an Image Log: How to load and view Azimuthal GR data
ZoneVu can create an Image Log from Azimuthal Gamma-Ray data. To create an Image Log, open up Scene Control, go to the Logs tab and find the LAS file with the Azimuthal Gamma-Ray data
Navigate to the Well's Folder, select the "Data", expand the "Log" Folder, and load the LAS file into the "LAS" folder How-To Import a .las File
Go to the 2D Viewer, open up Scene Control, and click on the "Logs" tab
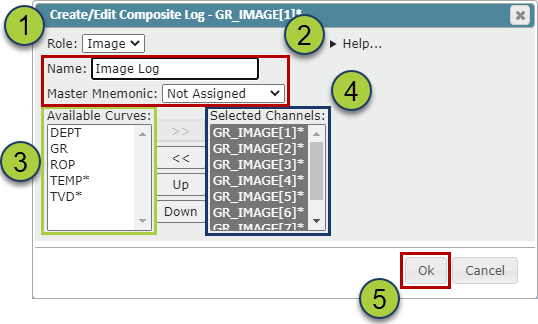
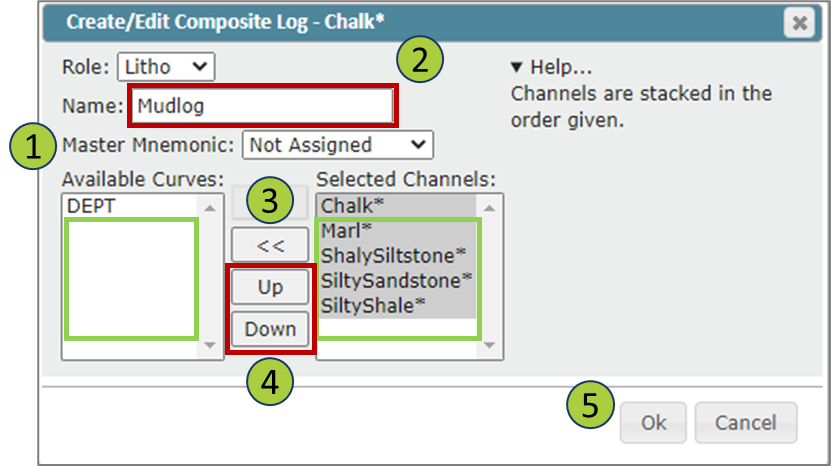
Now find the first Azimuthal Gamma-Ray Log in the log list, right-click on the log name and select "Create a Composite Log". This will open up the "Create Composite Log" pop-up
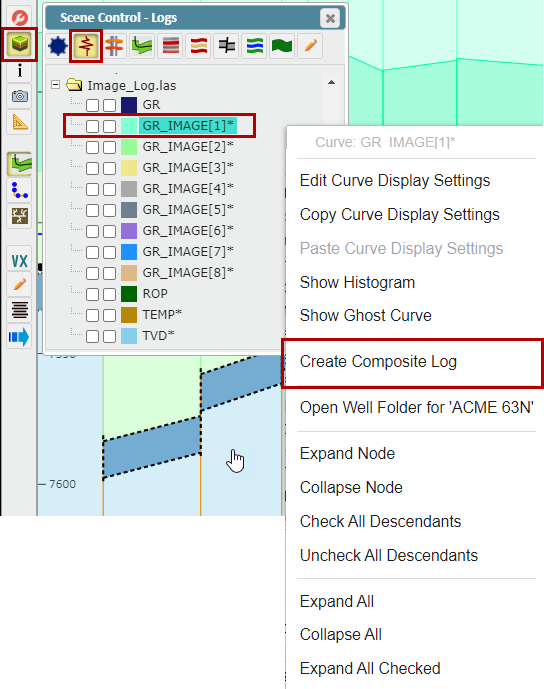
Give your Azimuthal Log a name in the "Name" input.
Note: if a Master Mnemonic is assigned, this Mnemonic will override the "Name" Input. If you want to use the "Name" input, change the Master Mnemonic to "Not Assigned"
Make sure under the "Type" dropdown you have selected "Image"
Then, Select all the Azimuthal Gamma-Ray Logs under the "Available Curves" column and use the ">>" button to move them over to the "Selected Channels" column
Order the Azimuthal Gamma-Ray Logs in a clockwise order using the "Up/Down" buttons
Click "OK" to create your Image Log
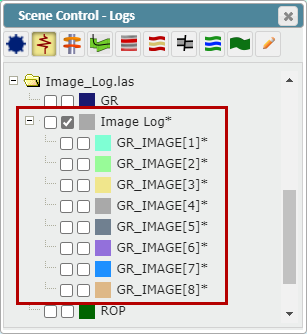
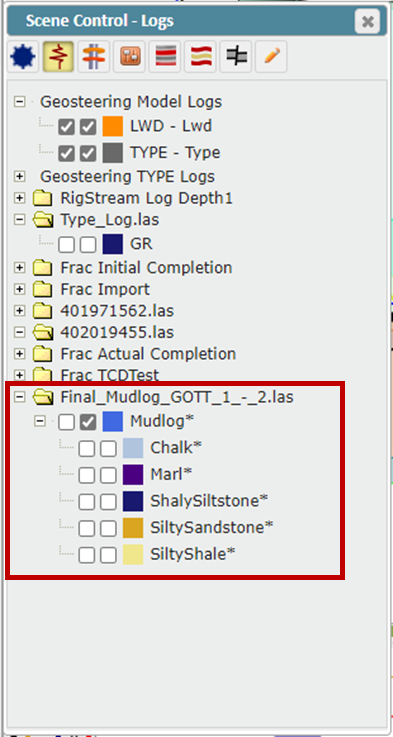
The newly created Image Log will now appear in the Log List with the associated logs nested underneath the Composite Log Folder
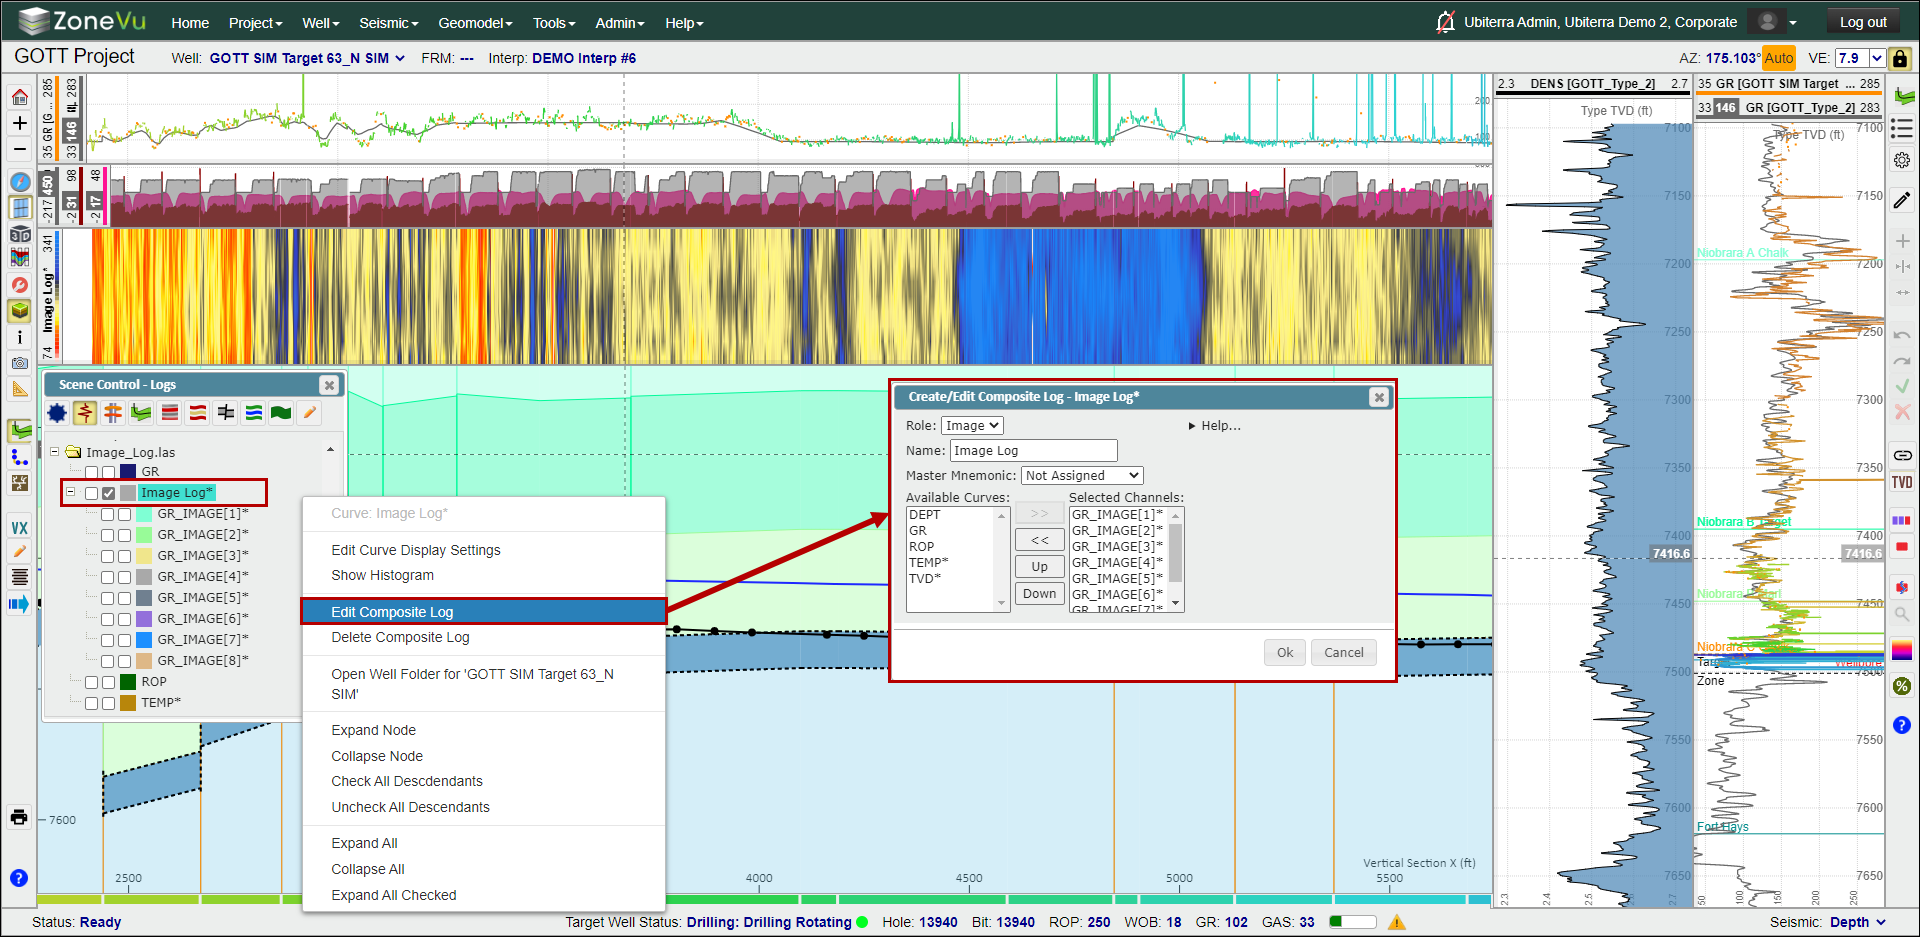
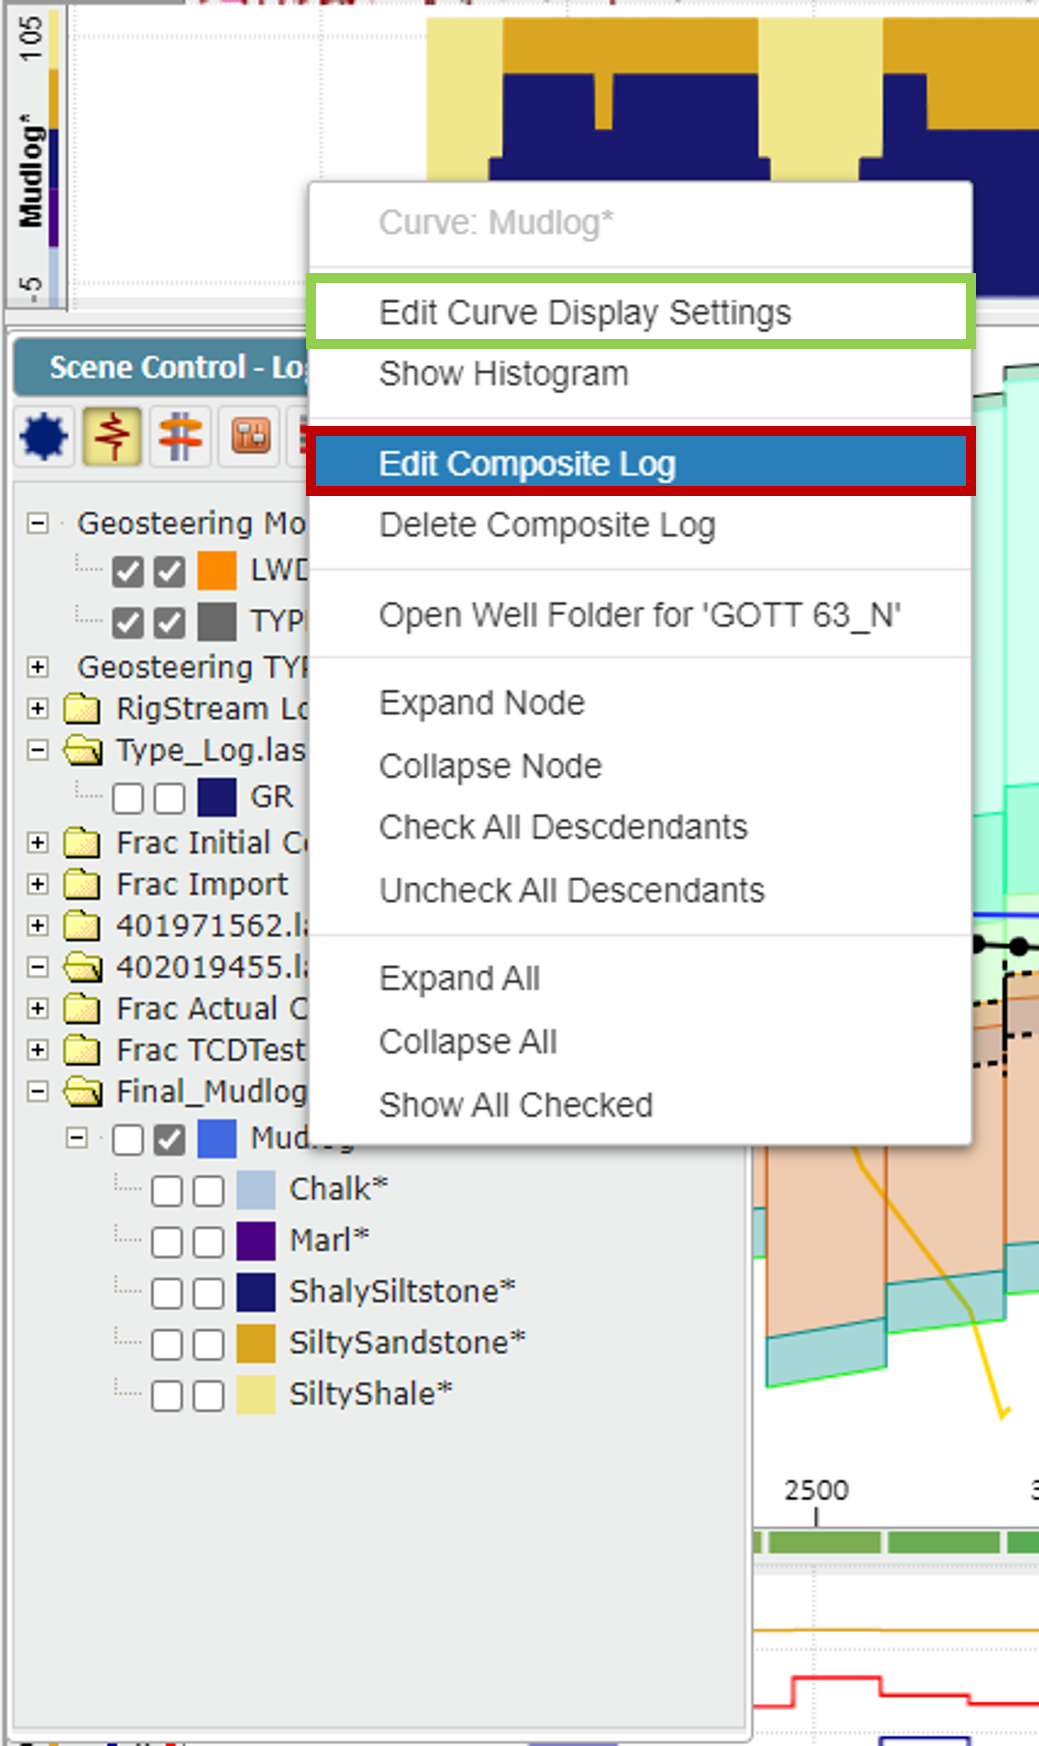
To edit the Composite Log parameters, right-click on the log name in Scene Control and select "Edit Composite Log"
To change the display parameters of the Composite Log either:
Double click on the log header in a Vertical or Horizontal Log Track
Click the colored box next to the Composite Log name in Scene Control
Right-click on the Composite Log name in Scene Control and select "Edit Curve Display Settings"
This will open the Composite Log Display setting where you can adjust the log scale, change the color pallet used (ZoneVu Color Spectrums), or show the Azimuthal Sinusoids. ZoneVu calculates and displays the Sinusoids based on the Geosteering Block dips.
How to create a Litho Log: Importing and Displaying Mudlog Data
ZoneVu can create a Lithology Log (Litho Log) from lithology LAS data. To create a Litho Log, open Scene Control, go to the Logs tab and find the LAS file with the lithology data. Note: you can make a Litho Log with any data type, not just lithology data!
Find the first lithology log in the logs list, right-click on the log name and select "Create a Composite Log". This will open the "Create Composite Log" pop-up
If a Master Mnemonic is assigned, this Mnemonic will override the "Name" Input. If you want to use the "Name" input, change the Master Mnemonic to "Not Assigned"
Make sure you have selected "Litho" under the "Type" dropdown
Give your Litho Log a name in the "Name" input field
Then, select all the lithology logs under the "Available Curves" column and use the ">>" button to move them over to the "Selected Channels" column
Order the lithology logs using the Up/Down buttons
Click "OK" to create your Litho Log
The newly created Litho Log will now appear in the Log List with the associated logs nested underneath the Composite Log Folder
To edit the Composite Log parameters, right-click on the log name in Scene Control and select "Edit Composite Log"
To change the general display parameters of the Composite Log either:
Double-click on the log header in a Vertical or Horizontal Log Track
Click the colored box next to the Composite Log name in Scene Control
Right-click on the Composite Log name in Scene Control and select "Edit Curve Display Settings"
To change the color of a lithology, click the colored box next to the lithology name in Scene Control to open the Log Curve Display settings, and select the color box to select a new color
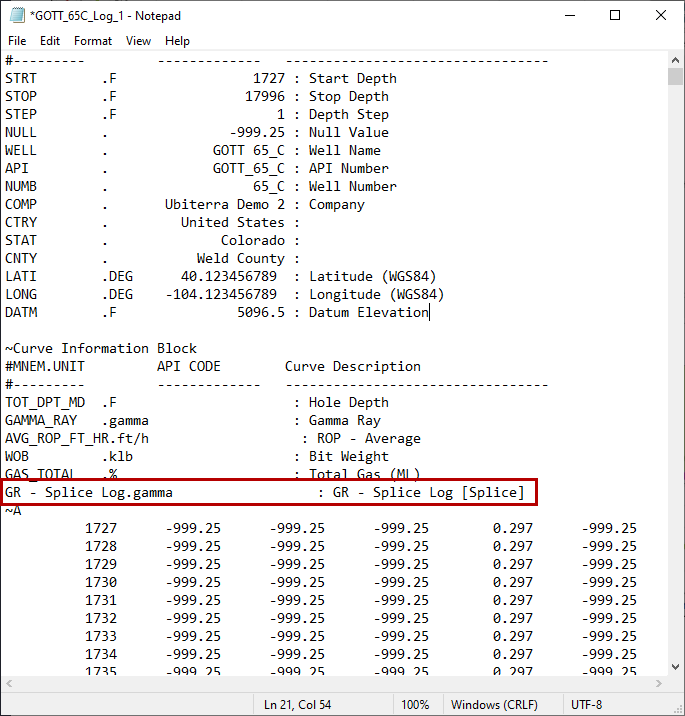
How to create a Spliced Log: Creating a Spliced Log in ZoneVu
ZoneVu's Splice Log tool allows you to splice together two or more Log Curves to use as a single curve. Each Log Curve Channel can be normalized and conditioned independently, allowing you to create a single unified curve that displays the rock or Well properties in a consistent way. Once you have completed the Well, you can export this Normalized Spliced Log out of ZoneVu in an .las.
This article will detail how to create, edit, and export a Spliced Log.
Creating a Spliced Log:
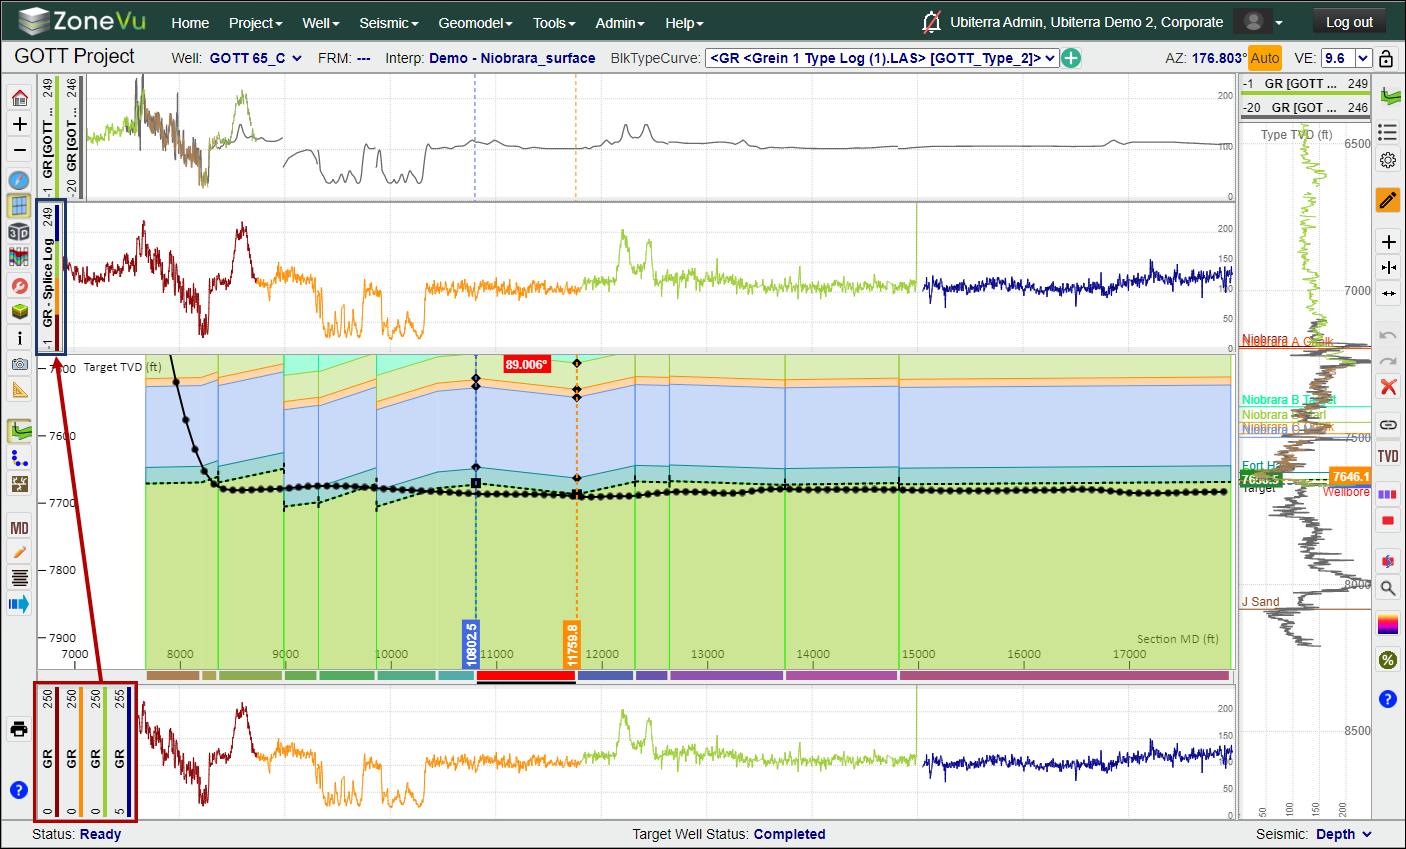
In the example below, this Well has had several BHA changes along the Lateral. Instead of working with 4 log curves in the Vertical and Horizontal Tracks, ZoneVu can splice these log curves together creating a single Spliced Log.
First, go to the "Logs" tab in Scene Control and find the Log you want the Splice Log to be housed in. This Log must have a Curve that will be used in the Spliced Log. Right-click on the Log Curve and select "Create Composite Log"
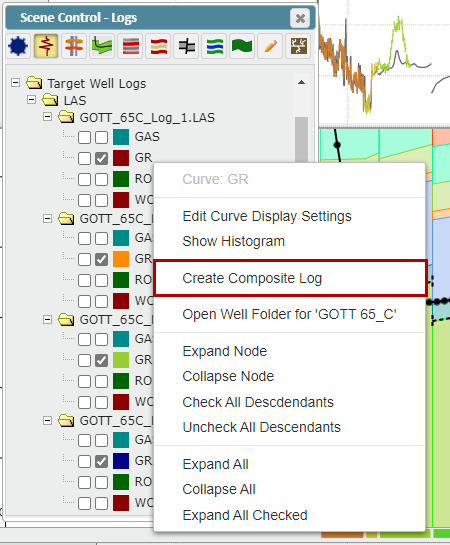
The Edit Composite Log dialog box will open.
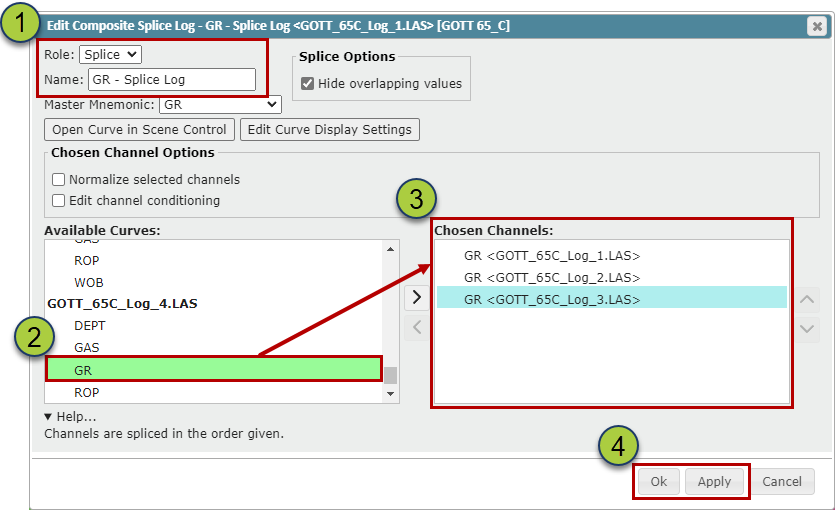
Use the "Role" dropdown to select "Splice" and name the Splice Log in the Name input field
Search through the log list in the "Available Curves" and use the ">" button to move the needed Log Curves over to the Chosen Channels list
Order the Log Curves from shallowest to deepest using the "Up/Down Arrow" buttons. This order will be used for data prioritization if there are overlapping data from the Splice Log Curve Channels
Click the "OK" or "Apply" button to create the Splice Log
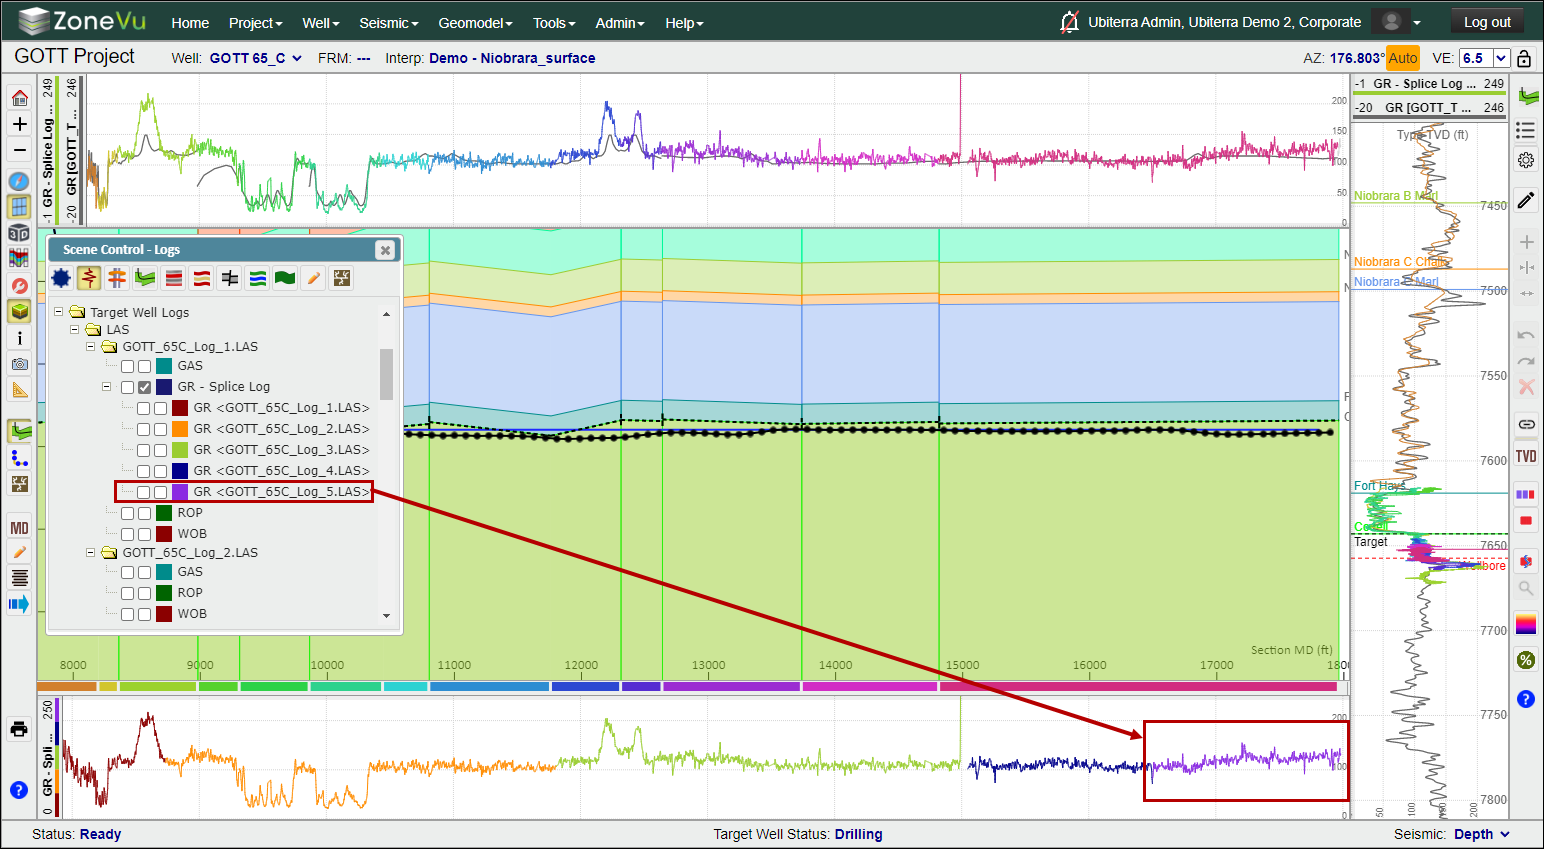
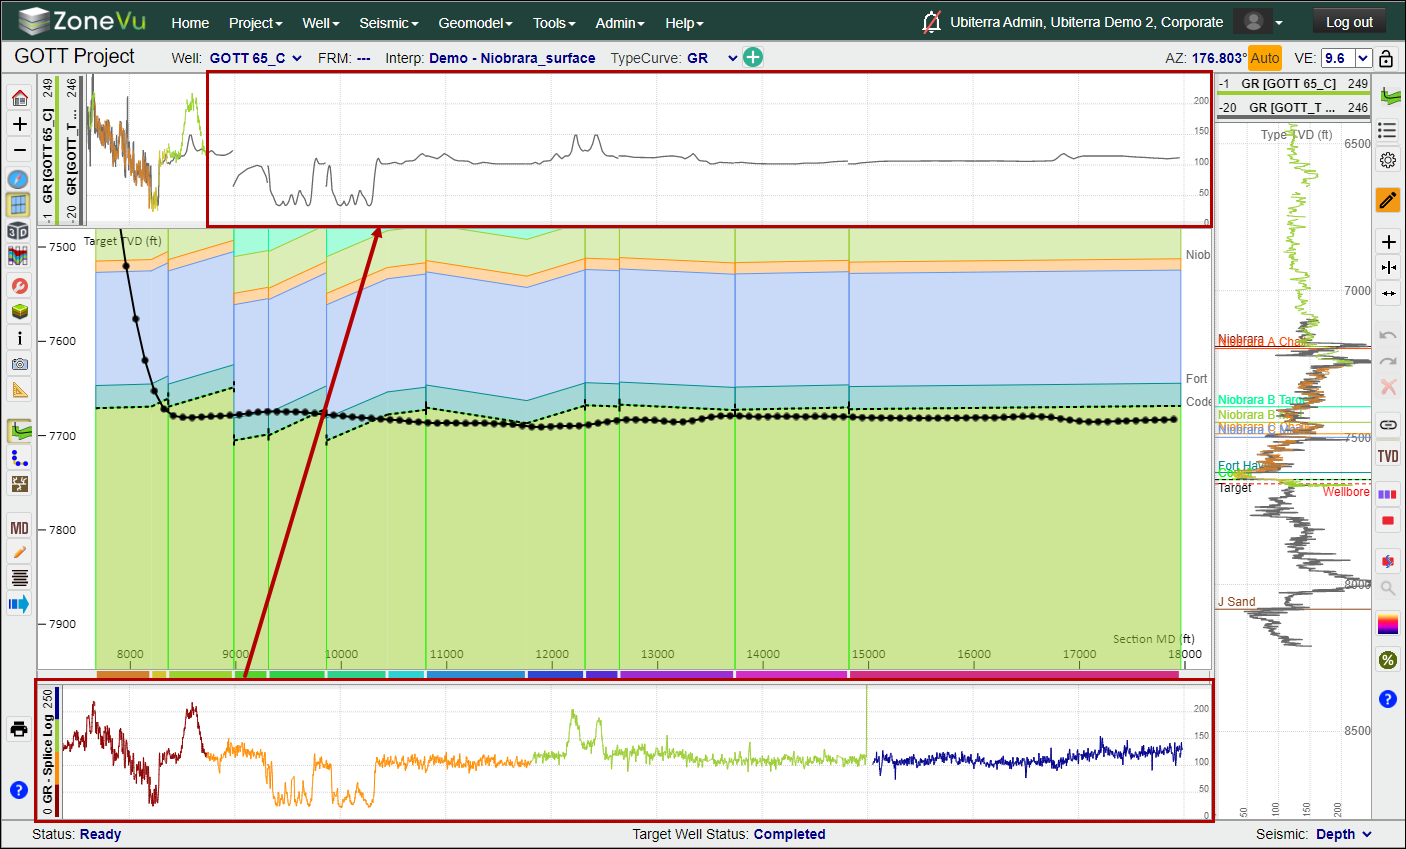
The newly create Splice Log will be placed in the Log that was first selected. Also, all Log Cuve Channels used in the Splice log will be moved from their original Log and nested under the Splice Log.
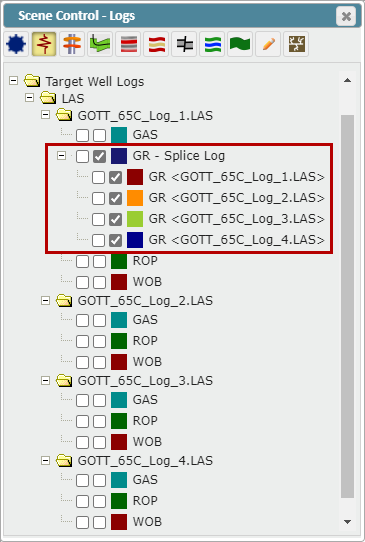
When you place the Splice Log in a Log Track, the Log Header Color Bar will display the Channel Log's Color and order. You can now use this Splice Log to display all of the Log Channel data with a single log, simplifying your Log data display
Editing the Spliced Log:
After you have created a Splice you can add/edit what Curve Channels are used, apply conditioning parameters to each Curve Channel, and/or normalize each Curve Channel. To open the "Edit Splice Log" dialog back, right-click on the Splice log name in Scene Control and select "Edit Composite Splice Log".
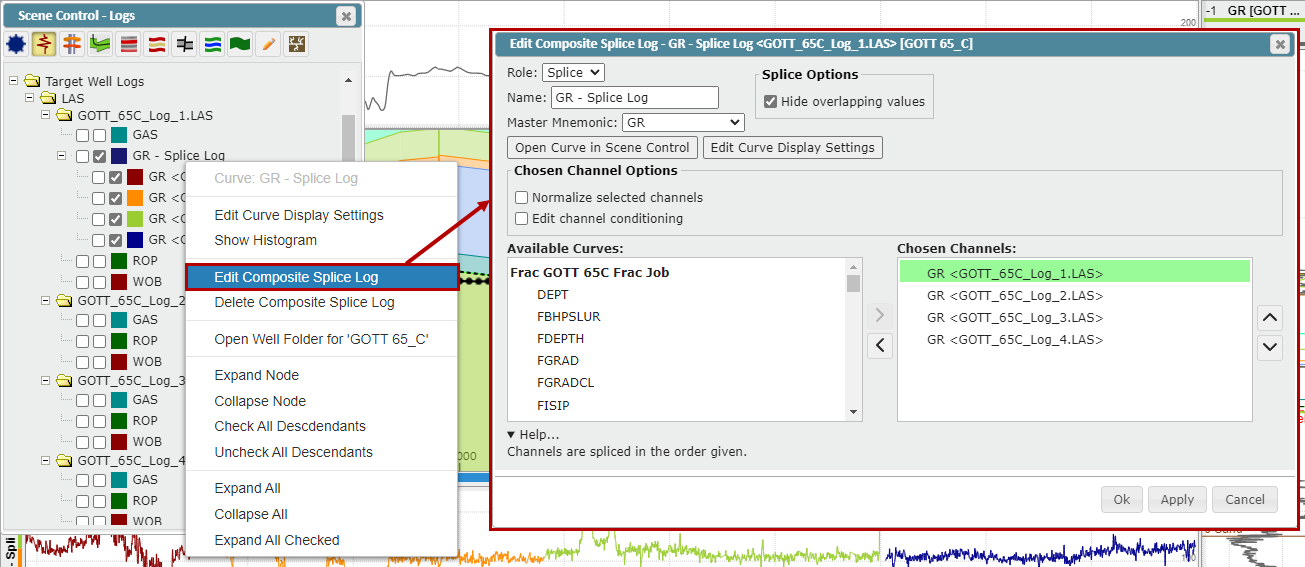
Adding a new Channel to the Spliced Log:
In the "Edit Composite Log" Dialog Box, find the new GR curve in the Available Curve List
Use the “>” button to move the selected curve to the Chosen Channels list
Click the “OK” button to save these changes.
Note: If your Curve is not displaying correctly, try adjusting its position in the Curve Channel list
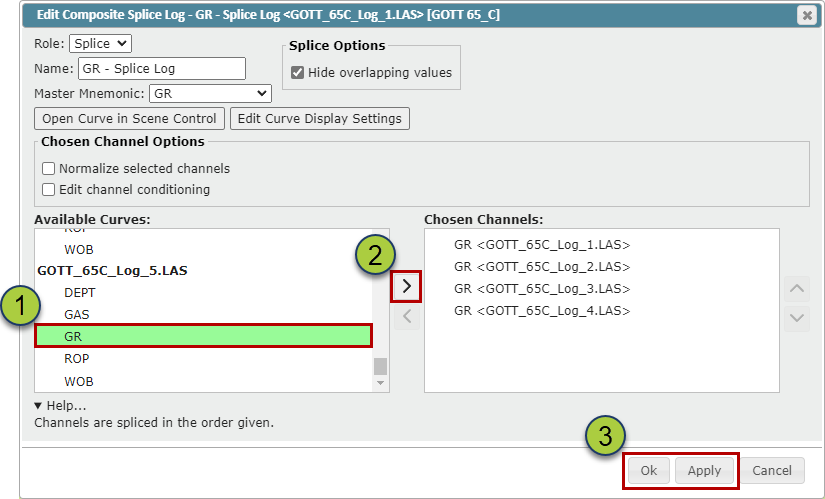
The new curve will now be used in the existing Splice Log.
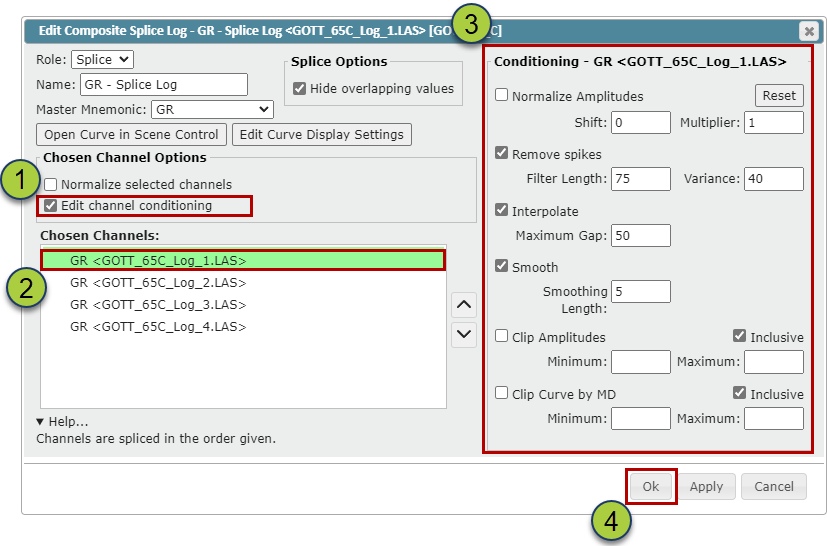
Apply Conditioning Parameters to Curve Channels:
You can apply a unique set of conditioning parameters to each Curve Channel, similar to what's found on the "Conditioning" tab in the Log Display Settings dialog box.
Check the "Edit channel conditioning" checkbox
Choose a Curve Channel to condition
Select and apply the Curve Conditioning parameters you want to apply to this Curve Channel
Repeat this process on all Curve Channels you need to adjust
Click the "OK" or "Apply" to apply these changes
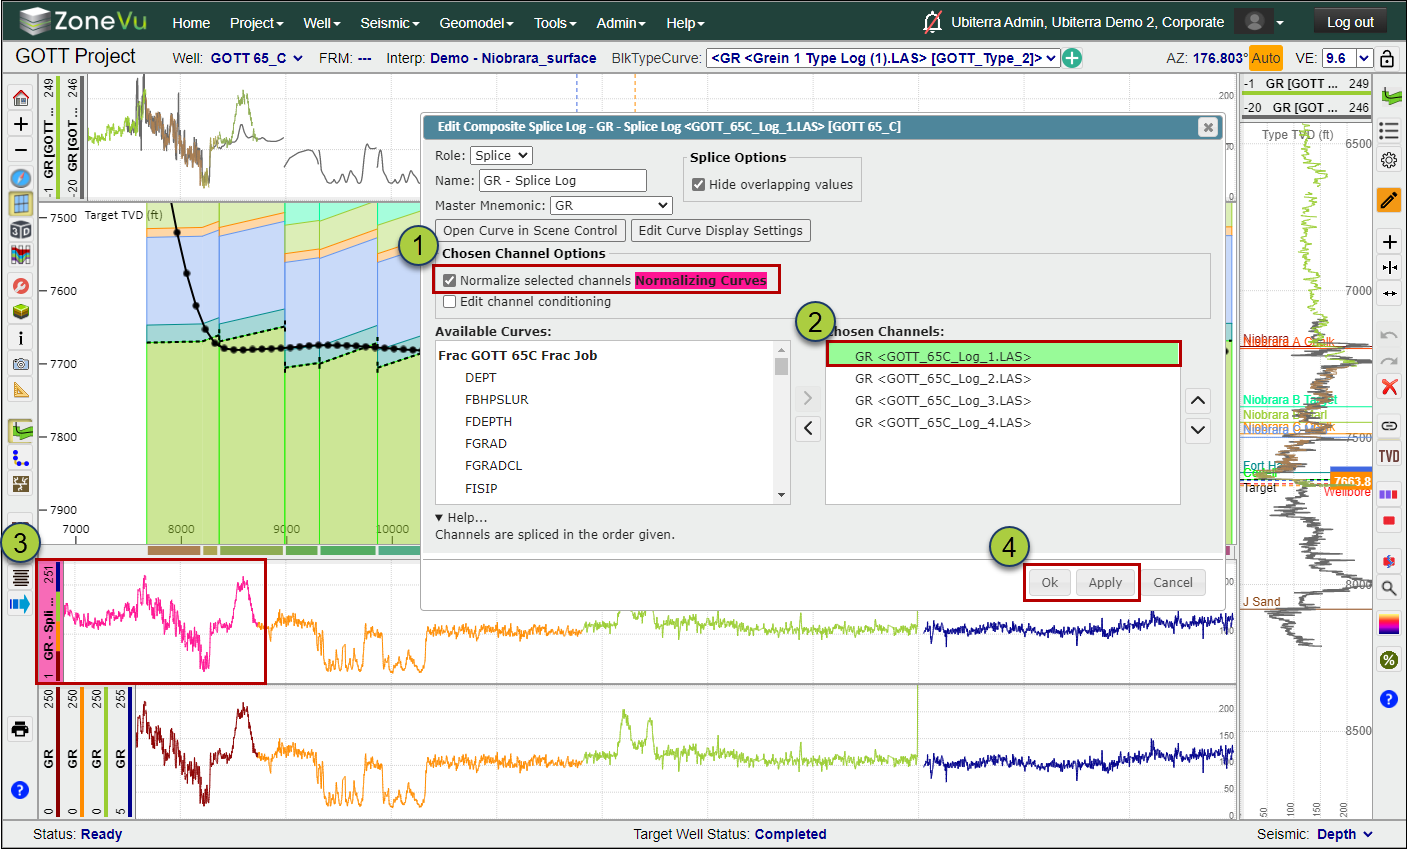
Normalizing Curve Channels:
If a Curve Channel in the Splice Log has a data shift or amplitude variance, you can normalize one or more Curve Channels so that the Splice Log displays the same amplitude and value for the same segment of rock despite what the original Curve's data may show. This allows the Splice Log to have a consistent and unified reading and display. These normalization parameters will be applied to the exported Splice Log data.
Check the "Normalize selected channels" checkbox
Select a Curve Channel to Normalize
The Log Header of the splice log will be highlighted pink indicating that you are in Normalization Mode. The log segment associated with the selected Curve Channel will also be colored pink. In the log track adjust the scale log positioning and any other display parameters. These changes will only be applied to the selected Curve Channel.
Click the "OK" or "Apply" to apply these changes
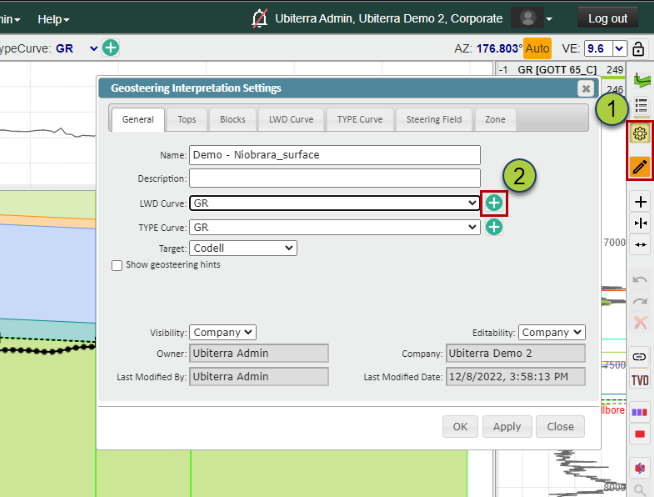
Making the Splice log the LWD Log:
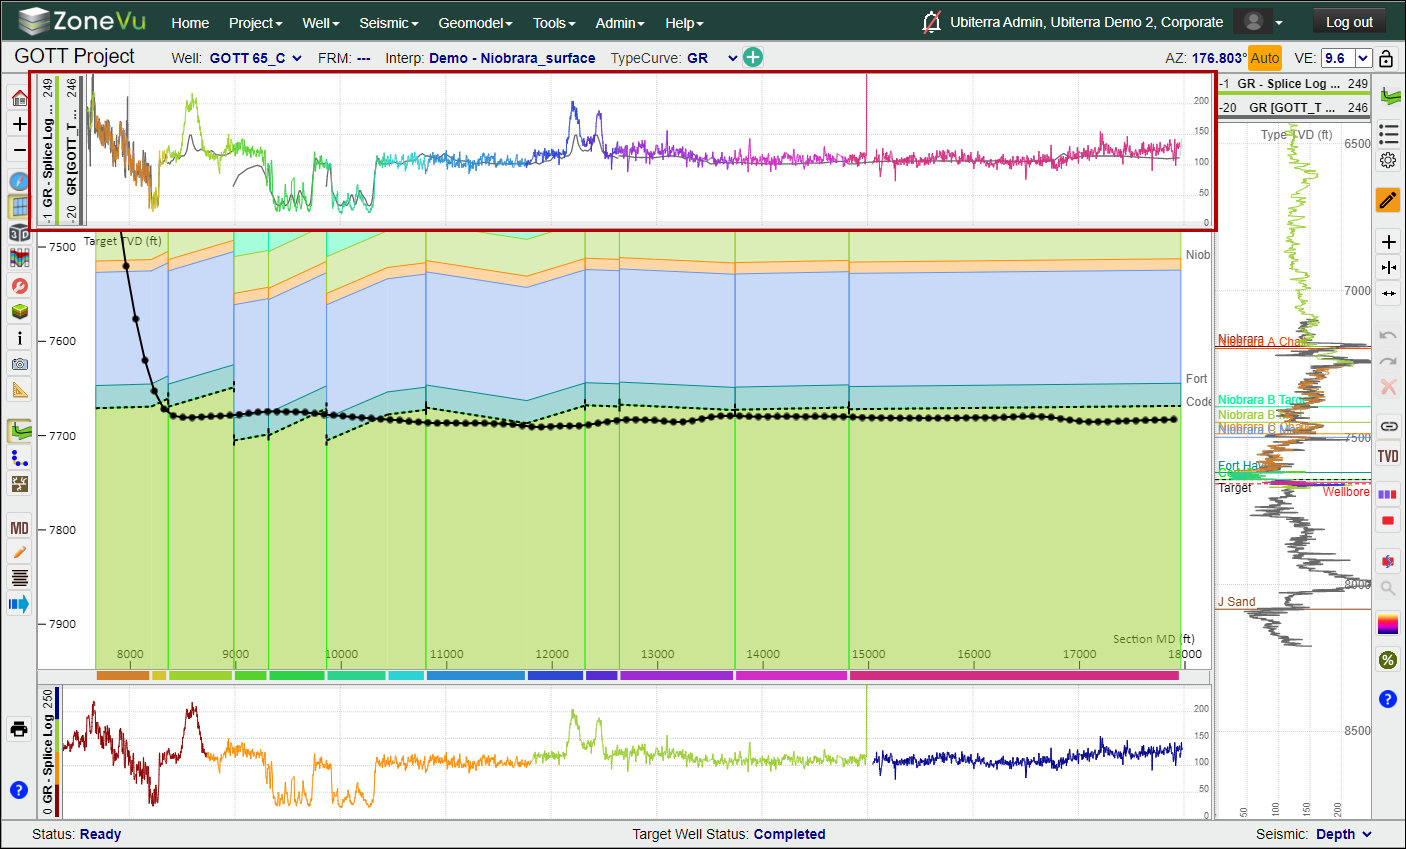
Once you have created a Splice Log, you can assign this Splice Log to the LWD curve. This allows you to splice together multiple RigStream Logs and/or LAS files, removing the need to display multiple logs in the same track to see the entire dataset while you Geosteer. In the example below, we have created a Splice Log that covers the entire Lateral, but the displayed Geosteering Interpretation is using the LAS data from the Vertical and Curve BHA.
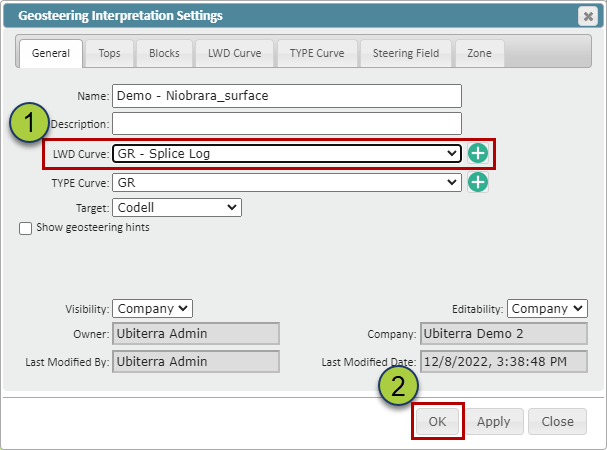
Open the Geosteering Interpretation Settings and make sure you are in Active Geosteering Edit Mode
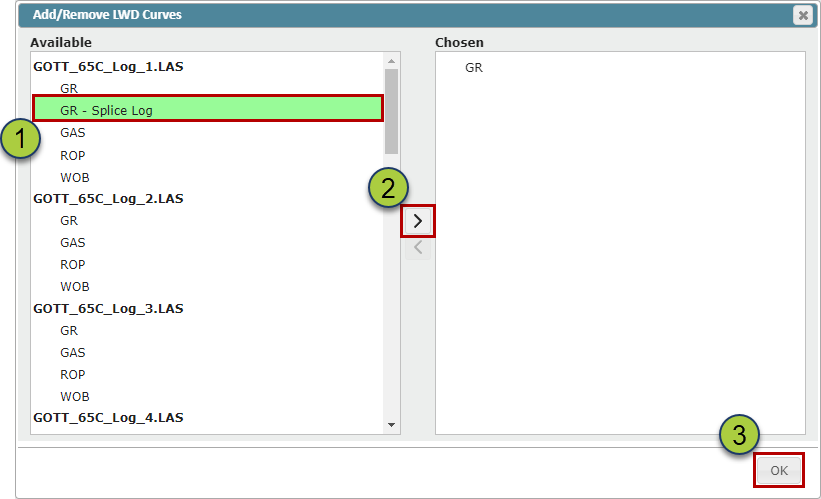
Click the green "+" button next to the "LWD Curve" dropdown to open the "Curve Selection" dialog box
Search through the log list to find and select the Splice Log
Use the ">" button to move the Splice log to the "Chosen" list
Click the "OK" button to save your selection
Use the LWD Curve" dropdown to assign the Splice Log as the active LWD Curve
Click the "OK" button to save your changes
The Splice Log data will now be used in the LWD Curve, allowing you to only manage one log curve for geosteering. If another BHA change occurs, then the only step you will need to take is adding this new Log Curve to the Curve Channels in the Composite Log Settings dialog box.
Exporting the Spliced Log:
ZoneVu can generate a normalized Log from the Spliced Log. This log will be added to the Log that houses the Splice Log in the Viewer.
To export this normalized Log, first go to the "Data" tab in the Log folder and Select the Subfolder the Log is saved in
Select the Log from the Log List
Click the "Export" button to export the LAS file
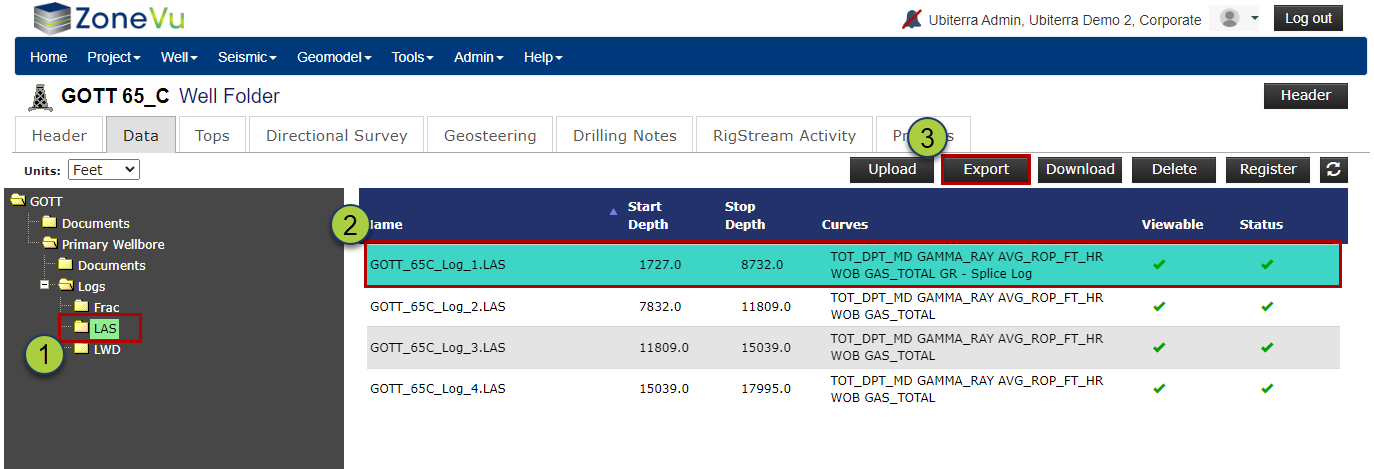
The Splice Log will be added to the end of the .las file