

Stage Table Buttons
 Toggle row zebra striping: display 3x3 row color variation for easier reading.
 Copy to clipboard: Copy the table to the computer's clipboard.
 Export: Export the table to an Excel workbook.
 Settings: Edit selected frac parameters and adjust table columns
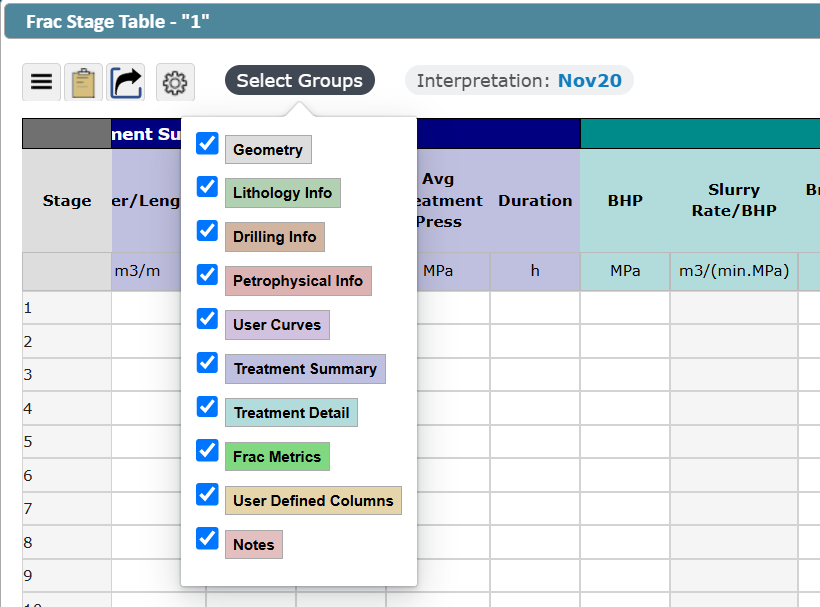
Select Group: Allows user to choose which data columns are visible in the 'Frac Stage Table'. Checking off a group will hide it until checked on again.
Interpretation Indicator: this will indicate which geosteering interpretation is being used to
Frac Settings
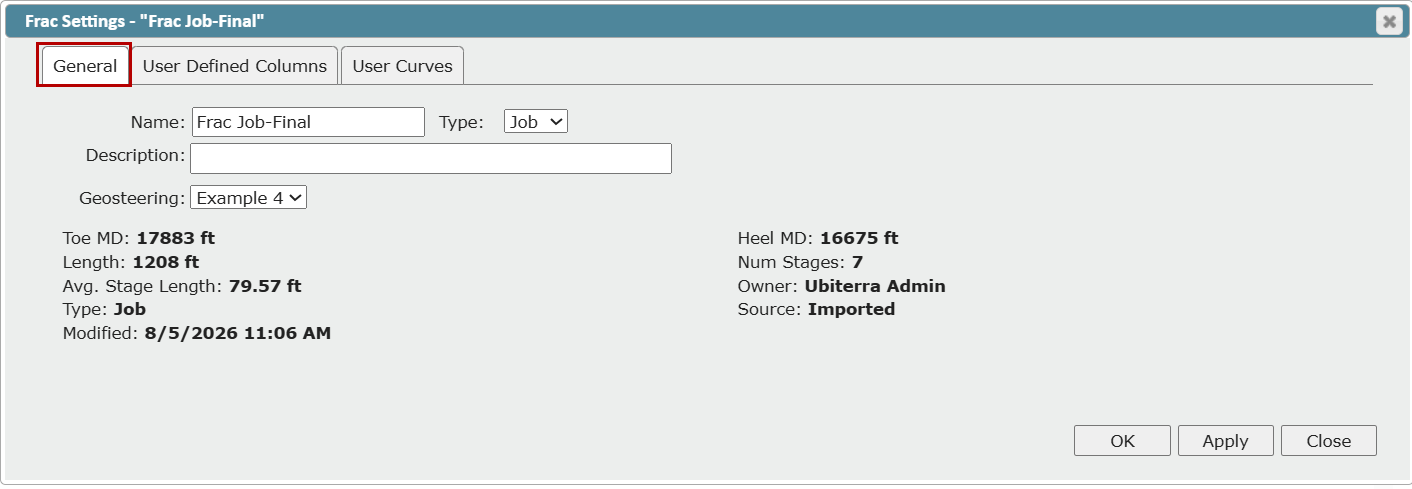
General Tab
Update Frac name
Update Frac Type - Plan or Job
Add a frac description
Change the associated geosteering interpretation
Read out of frac parameters (not editable from this dialog)
User-Defined Columns Tab
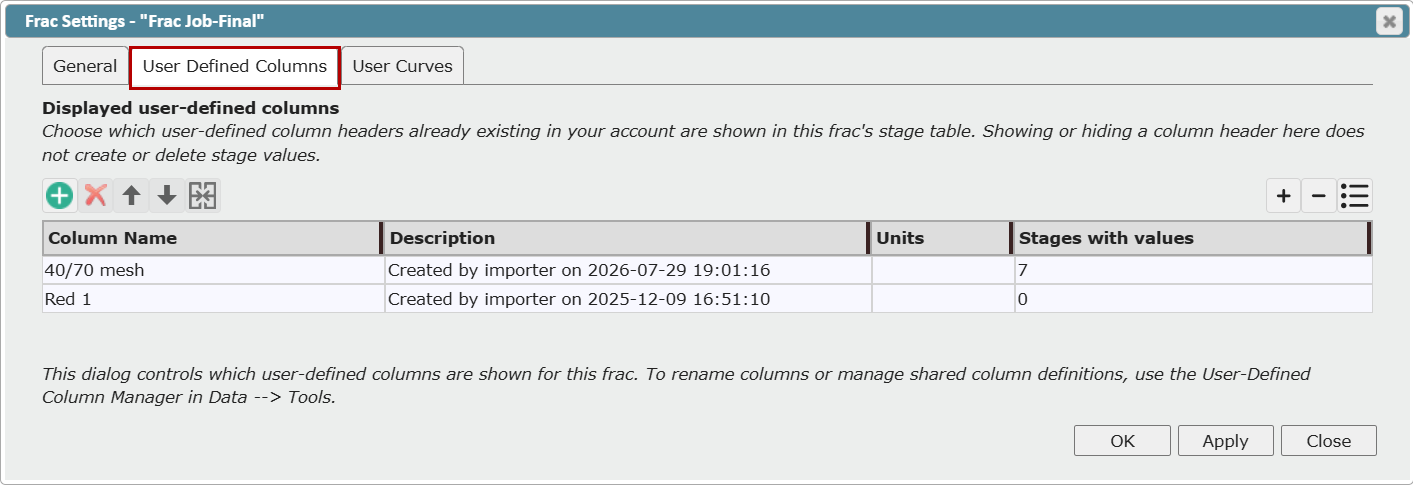
See User-Defined Columns in ZoneVu Frac
See list of all User-Defined Columns for a frac
Add or remove User-Defined Columns for a frac
Reorder user Defined Columns for a frac.
Merge or transfer data between User Defined Columns. See Merge User-Defined Columns
User Curves Tab
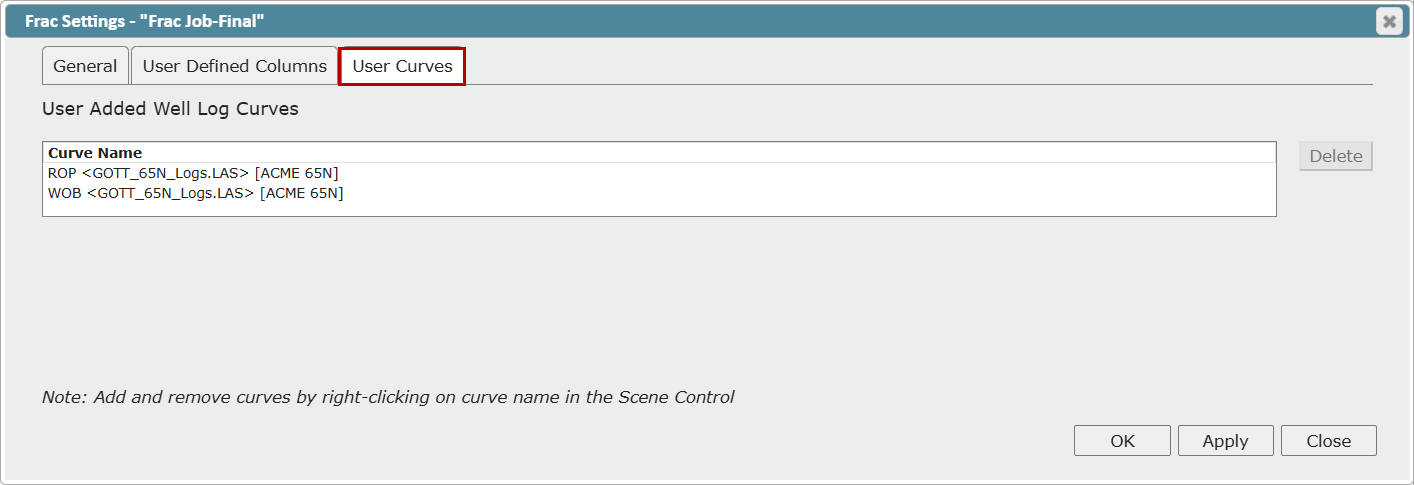
See a list of all User Curves added to a frac
remove User Curves from a frac.
See User Curves: Sampling log data to the Frac Table
Stage Table Groups
Geometry
Stage: Stage Number
Toe MD (ft or m): MD depth defining the toe-ward most extent of the Stage: Usually the MD depth of the bounding Toe-Plug
Heel MD (ft or m): MD depth defining the heel-ward most extent of the Stage: Usually the MD depth of the bounding Heel-Plug
Mid MD (ft or m): Calculated mid-Stage MD depth
Length (ft or m): Calculated distance between the Toe MD and Heel MD inputs
TVD (ft or m): Calculated true vertical depth of the wellbore at the mid-Stage MD depth
Lithology Info
Defined by the associated geosteering interpretation
Percent in Zone (%): The percent in Target Zone of each stage based on the assigned geosteering interpretation.
Formations: The list of formations each stage touches in based on the assigned geosteering interpretation.
Lithology (text, %): The weighted percent lithology each stage based on the assigned geosteering interpretation. The 'Lithology Type' needs to be set in the associated 'Stratigraphic Column' for this to calculate.
Faults (Num, (ft or m)): Calculated number of faults per stage and the total throw on those faults. Ex: 2 (15), would mean two faults with a combined 15 feet of throw.
Avg TVD to Target Top (ft or m): Calculated average distance from the average TVD point along the stage to the top of the target zone.
Max TVD to Target Base (ft or m): Calculated maximum distance from any TVD point along the stage to the top of the target zone.
Avg TVD to Target Top (ft or m): Calculated average distance from the average TVD point along the stage to the base of the target zone.
Max TVD to Target Base (ft or m): Calculated maximum distance from any TVD point along the stage to the base of the target zone.
Drilling Info
GR gAPI: Calculated average gamma ray
ROP (ft/h or m/hour): Calculated average rate of penetration
WOB (lbft or N): Calucated average weight on bit
GAS (%): Calculated average gas
MSE (MPa): Calculated average mechanical specific energy
Avg Dogleg Severity (dega/ft(100) or dega/m(30)): Calculated average dogleg severity
Max Dogleg Severity (dega/ft(100) or dega/m(30)): Calculated maximum dogleg severity
Selection of logs for average Drilling Info per stage: ZoneVu selects curves from the Target Wellbore’s logs, not from the Type Wellbore. When more than one Target wellbore log file contains a matching curve, the system gives priority to splice composites, then curves from the same LWD file used for steering, then Target Well RigStream Log and finally Target Well LAS Logs.
Petrophysical Info
Phi (%): Average Porosity
Sw (%): Average Water Saturation
Vsh (%): Average Volume of Share
SoPhiH (%): Average of the value representing the Oil saturation x Porosity x Thickness
Adding average petrophysical data: Average petrophysical data can be imported using the Frac Import spreadsheet. ZoneVu can also do a weighted calculation if there is has been petrophysical information including in the Tops data for the Type Well used in the associated geosteering interpretation. See How to Import Well Tops.
User Curves
The per stage average of any log curve available in scene control can be added to the Frac Stage Table. The units for the User Curves are taken the curve header. See User Curves: Sampling log data to the Frac Table
Treatment Summary
Num Clusters (num): The number of clusters per stage
Proppant / Length (lbm/ft or kg/m): Calculated proppant per stage using the calculated stage length and Proppant Weight
Water / Length (bbl/ft or m³/m): Calculated water per stage using Stage length and Water Vol.
Proppant Weight (lbm or t): Total proppant weight for the stage
Water Vol (bbl or m³): Total water volume for the stage
Slurry Rate (bbl/min or m³/min): Pumping rate for the stage
Avg Treatment Press (psi or MPa): Average treatment pressure for the stage
Duration (h): Duration of the treatment for the stage
Treatment Details
BHP (psi or MPa): average bottom hole pressure for the stage
Slurry Rate / BHP (bbl/min*psi or m³/min*MPa): Calculated Slurry Rate over Bottom Hole Pressure
Breakdown Press (psi or MPa): Breakdown Pressure of the Stage
Closure Pressure (psi or MPa): Closure Pressure of the Stage
Avg Surface Press (psi or MPa): Average Surface Pressure of the Stage
Max Surf Press (psi or MPa): Maximum Surface Pressure of the Stage
Max BHP (psi or MPa): Maximum Bottom Hole Pressure of the Stage
ISIP (psi or MPa): Instantaneous shut-in pressure of the Stage
Closure Grad (psi/ft or MPa/m): Closure gradient of the Stage
Fracture Grad (psi/ft or MPa/m): Frac gradient of the Stage
Slurry Vol (bbl or m³): Total slurry volume for the Stage
Avg Proppant Conc (lbm/bbl or t/m³): Average proppant concentration of the Slurry
Max Proppant Conc (lbm/bbl or t/m³): Maximum proppant concentration of the Slurry
Acid Vol (gal US, L): Total acid volume per stage
FR Fluid Vol (gal US, L): Total liquid friction reducer used per stage
FR Powder Mass (lbm, kg): Total powdered friction reducer used per stage
Biocide Vol (gal US, L): total biocide volume per stage
Clay Stabilizer Vol (gal US, L): The average clay stabilizer volume by stage
Scale Inhibitor Vol (gal US, L): The average scale inhibitor volume by stage
Water Salinity (mg/L): The average treatment water salinity by stage. This value has the same unit in metric and US
Time to Max Injector Rate (min): The time it takes to get to the maximum injector rate per stage
Plug Type: text format for type of plug
Frac Metric
Screened Out: Check box (boolean values) capturing if the staged screened out.
Frac Hit: Check box (boolean value) capturing if the stage caused a Frac Hit on a nearby Well
Frac Quality: This value is a qualitative value users can determine for themselves.
Frac Length - Up: Average length of frac wings in the up direction per stage
Frac Length -Down: Average length of frac wings in the down direction per stage
Frac Length - Left: Average length of frac wings in the left direction per stage
Frac Length - Right: Average length of frac wings in the right direction per stage
Frac Azimuth: The azimuth of the frac plan relative to true north. The valid value range is 0 to 356.99.
User-Defined columns
ZoneVu Frac allows for the import of up to five User-Defined Columns populated with integer data (Numbers with decimals). ZoneVu Frac will update the Column Names in the Stage Table with any text added after the bar "|" in the header. For example, if User Defined Column #1 has a header of "User1| Acid Volumes", after import, User-Defined Column #1 in the Stage Table will be renamed "Acid Volumes"
See User-Defined Columns in ZoneVu Frac
Notes
Every stage in a frac has a 'Notes' column at the end of the Stage Table. This column can contain any information.
Export Frac Stage Table
ZoneVu 'Frac Stage Tables' can be exported as Excel Workbooks from the 'Frac Stage Table', as well as from the 'Frac Plans and Jobs' list.
Importing Frac Stage Table
See How to Import Frac Data and Appending New Data to an Existing Frac
Stage Table Units
Units for standardized data columns: Units the columns of the stage table can be imported. Each import spreadsheet should contain either all metric or all US units.
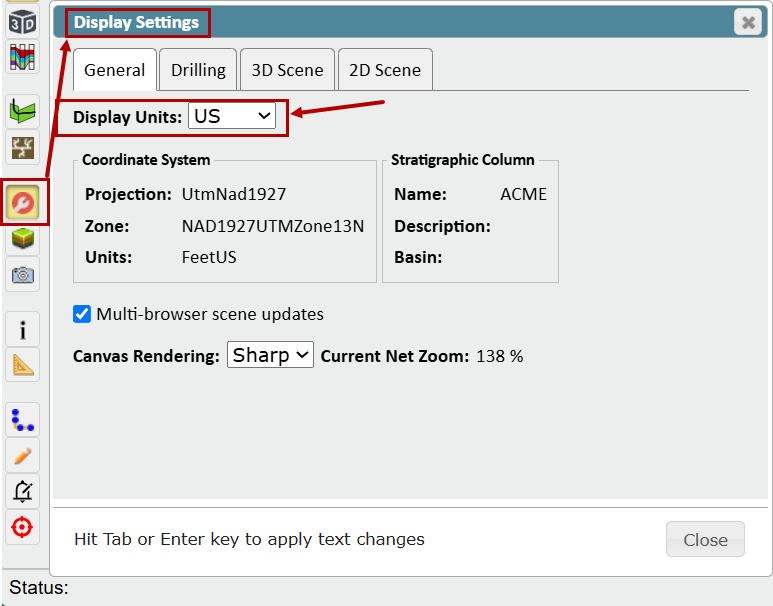
Use the 'Display Settings' button in the 'Main Button Tree' of the Viewer to change the 'Display Units' to US or Metric. This option is located on the 'General' tab of the 'Display Settings' dialog.
Units for Users Curves: The units for 'User Curves' will come from the log curve header information.
Units for User-Defined Columns: the units for 'User-Defined Columns' can be selected by the user for each column via the User-Defined Columns Manager. See User-Defined Column Manger