ZoneVu can create an Image Log from Azimuthal Gamma-Ray data. To create an Image Log, open up Scene Control, go to the Logs tab, and find the LAS file with the Azimuthal GR data
Navigate to the Well's Folder, select the "Data", expand the "Log" Folder, and load the LAS file into the "LAS" folder. See How-To Import a .las File
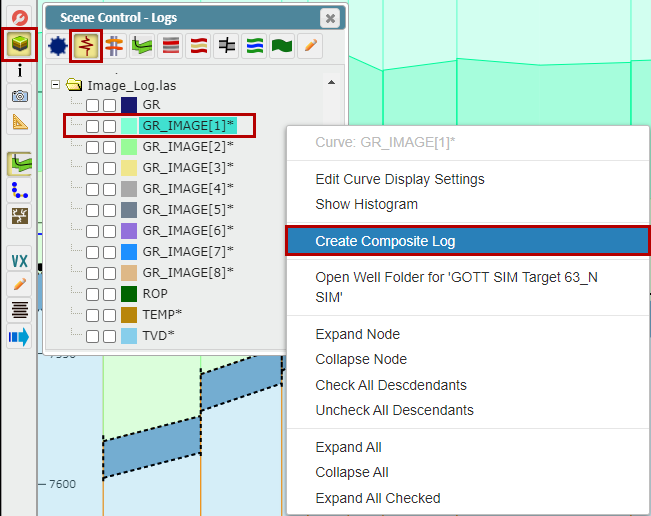
Go to the 2D Viewer, open up Scene Control, and click on the "Logs" tab
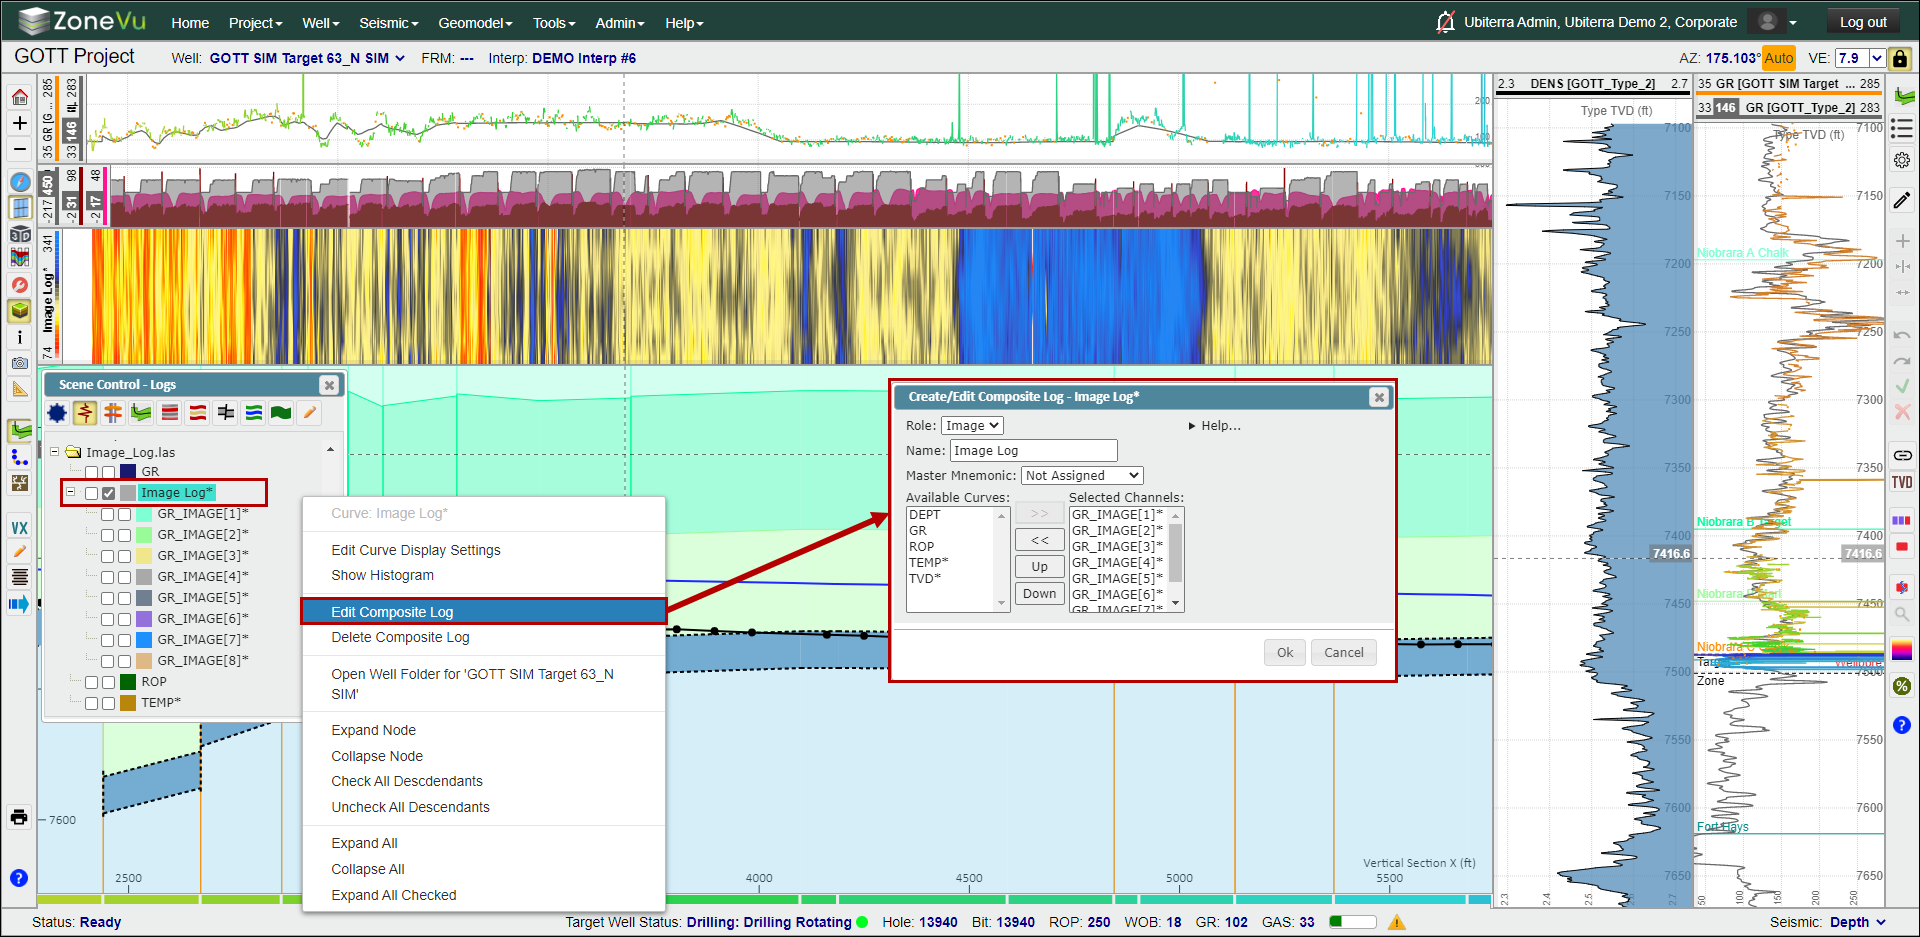
Next, find the first Azimuthal Gamma-Ray Log in the log list, right-click on the log name and select "Create a Composite Log". This will open the "Create Composite Log" pop-up
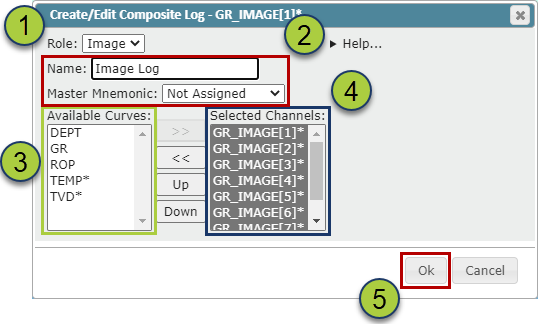
Give your Azimuthal Log a name in the "Name" field.
Note: if a Master Mnemonic is assigned, this Mnemonic will override the "Name" input. If you want to use the "Name" input, change the Master Mnemonic to "Not Assigned"
Make sure under the "Type" dropdown you have selected "Image"
Then, select all the Azimuthal Gamma-Ray Logs under the "Available Curves" column and use the ">>" button to move them over to the "Selected Channels" column
Order the Azimuthal Gamma-Ray Logs in a counter-clockwise order (Up, Left, Down, Right) using the "Up/Down" buttons
Click "OK" to create your Image Log
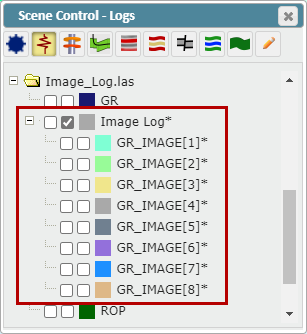
The newly created Image Log will now appear in the Log List with the associated logs nested underneath the Composite Log Folder
To edit the Composite Log parameters, right-click on the log name in Scene Control and select "Edit Composite Log"
To change the display parameters of the Composite Log, either:
Double click on the log header in a Vertical or Horizontal Log Track
Click the colored box next to the Composite Log name in Scene Control
Right-click on the Composite Log name in Scene Control and select "Edit Curve Display Settings"
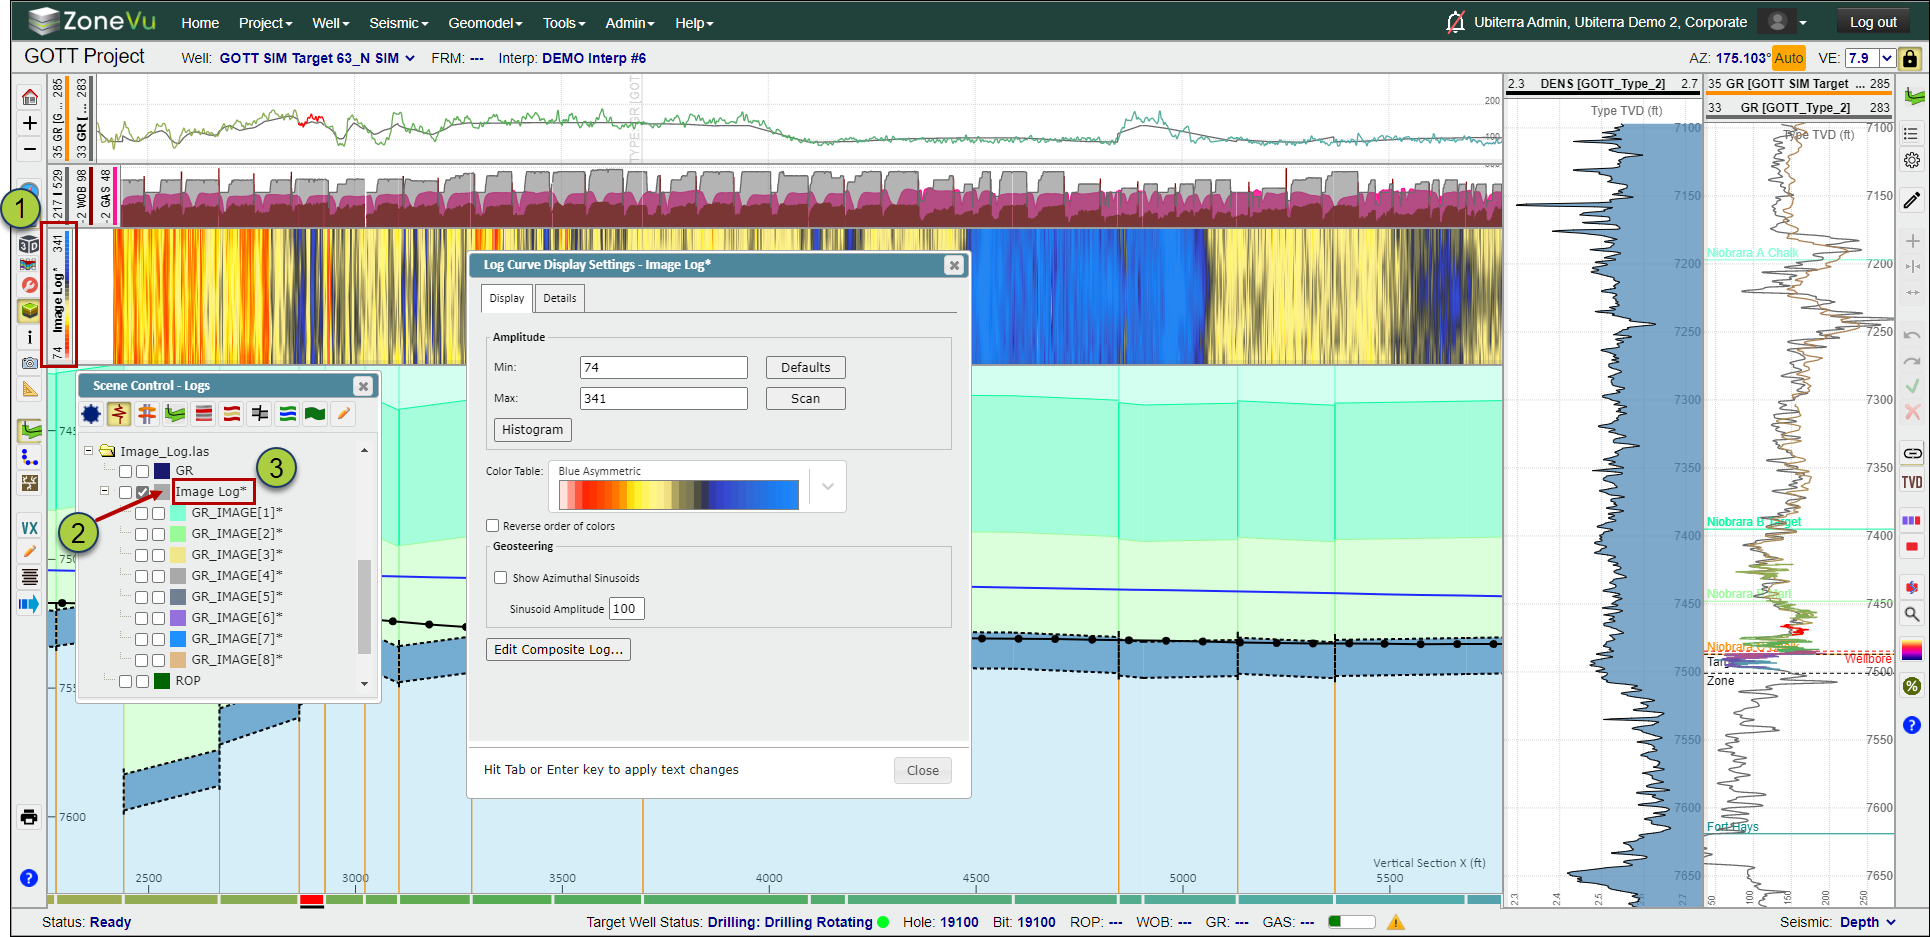
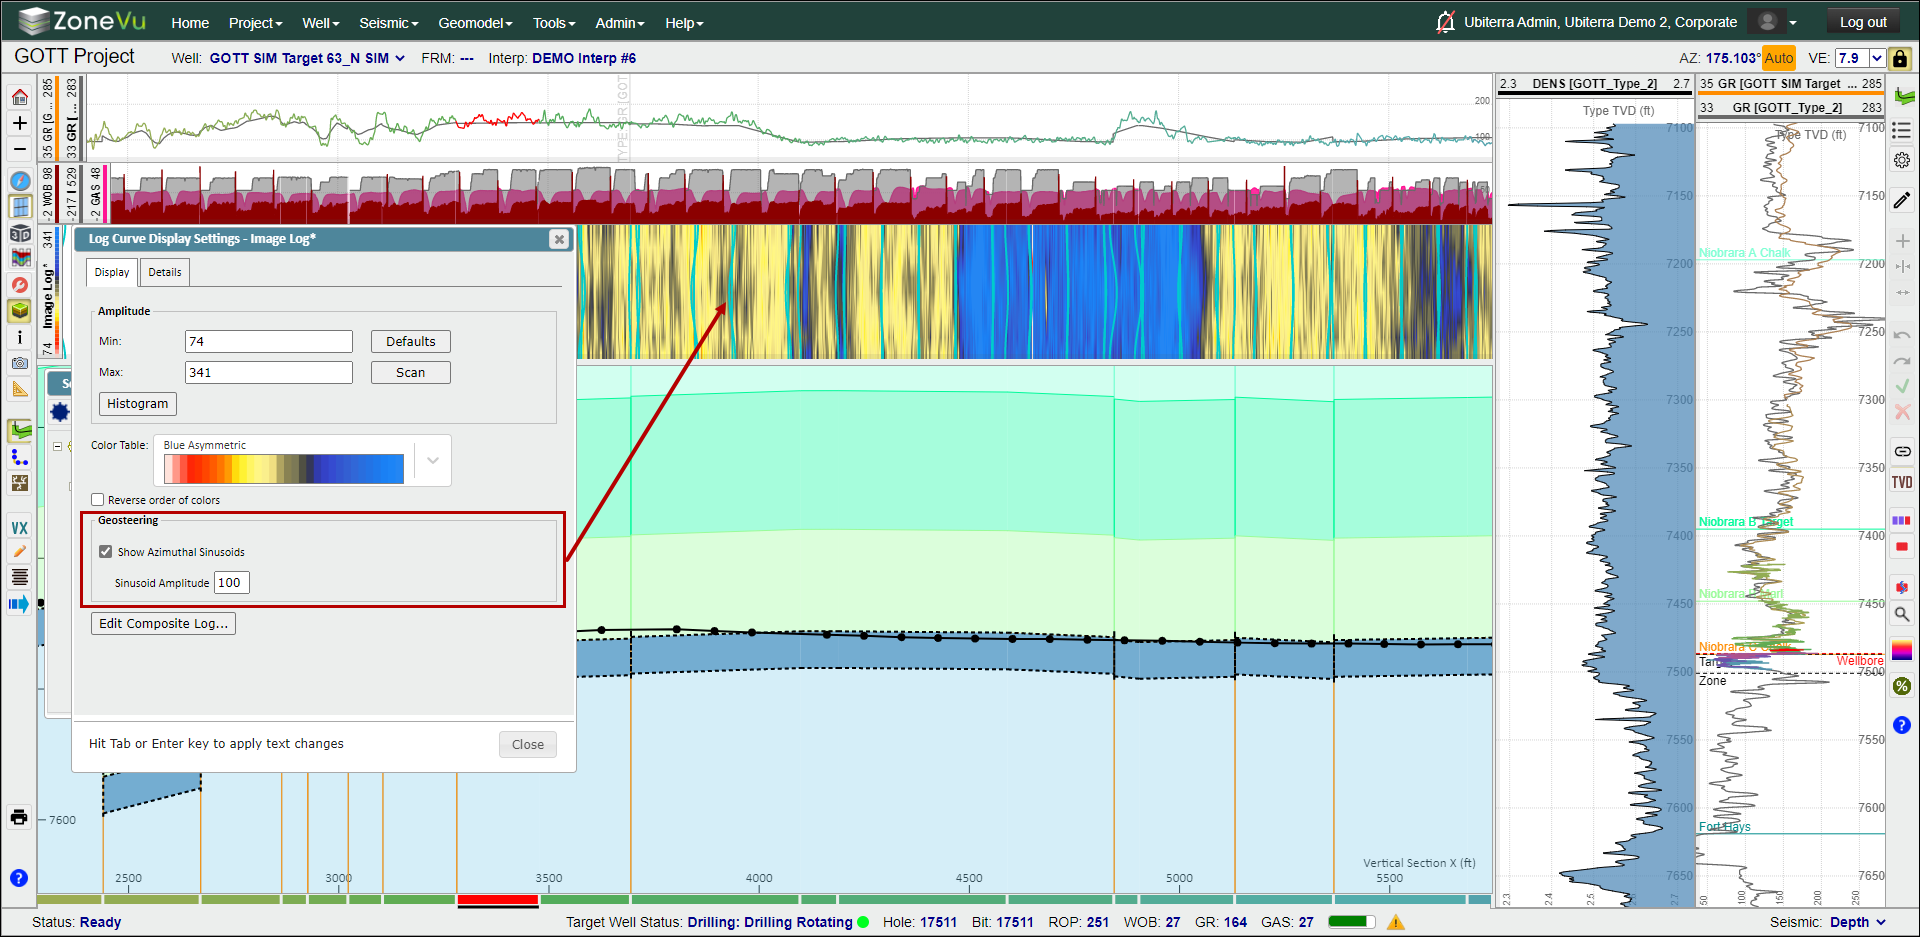
This will open the Composite Log Display setting where you can adjust the log scale, change the color pallet used (ZoneVu Color Spectrums), or show the Azimuthal Sinusoids. ZoneVu calculates and displays the Sinusoids based on the Geosteering Block dips.