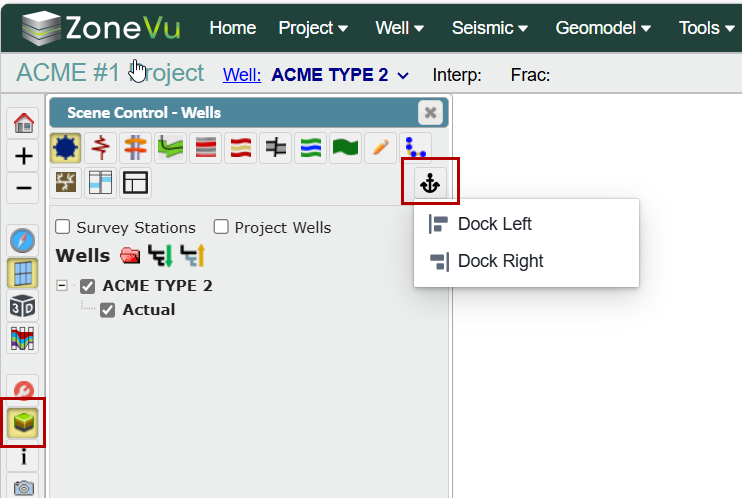
Open the Scene Control window by clicking the "Scene Control" button on the left side of the screen. You can move this window around on the Viewer by clicking on the top blue border and dragging it.
Use the "Anchor" button to dock the Scene Control window, on either the left or to the right of the viewer.
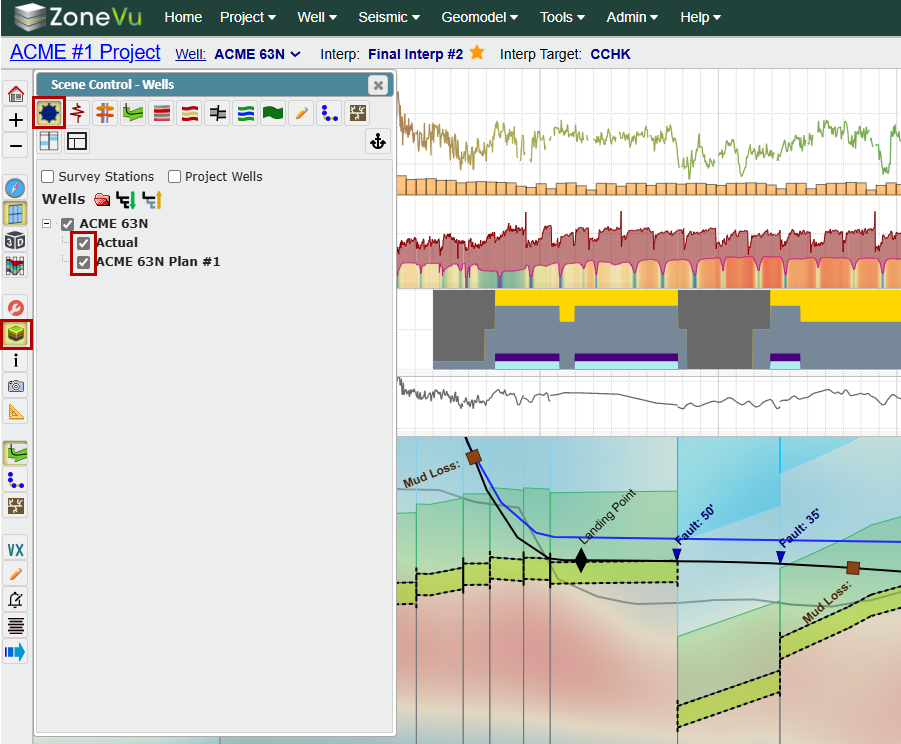
Wells Tab:
By default, the Wells tab only shows the Target Well. All Directional Surveys [Plan(s) & Actual] are nested under the Well name. Use the icons to expand or collapse the list
Click the checkboxes to toggle plans on and off in the Cross Section
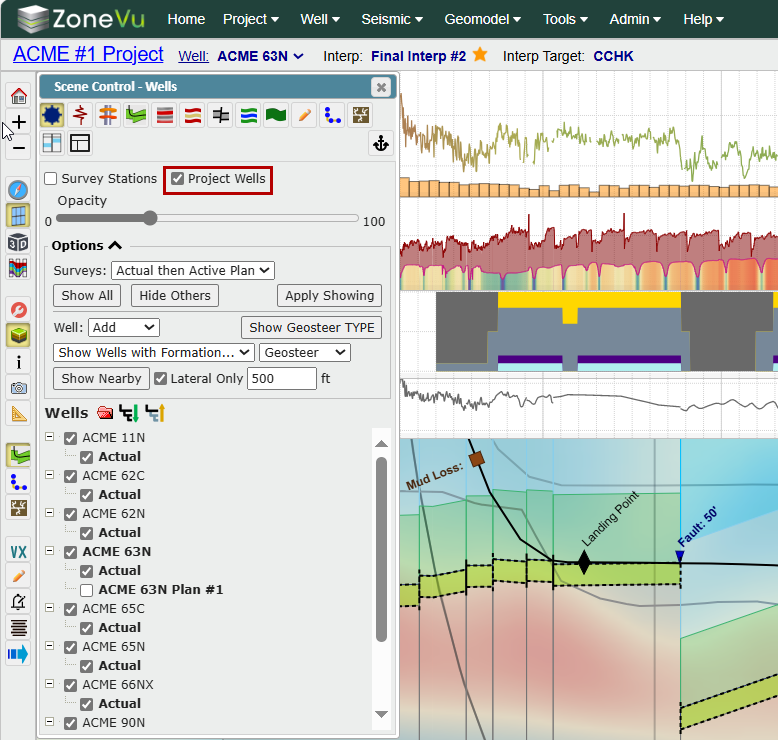
Click the "Project Wells" checkbox to display every well that has been loaded into the project. Clicking this also displays the "Options" menu, which you can toggle on and off to see advanced search and display functionality
Opacity Slider: Controls the opacity of all non-Target Wells
"Surveys" dropdown: Allows you to bulk select or deselect available deviation plan(s) and/or actual
All: Turns on all Actual and Plan Deviation Surveys for all wells
Actuals then Plans: This will turn on all Actual Surveys only for each well, if the well does not have an Actual Survey ZoneVu will display the default Plan Survey
Actual Only: This will turn on only the Actual Survey(s)
Plan Only: This will turn on only the Plan Survey(s)
"Show All" button: Turns on all wells in the project [Plan(s) and Actual Surveys]
"Hide All" button: Turns off all non-Target Wells in the project [Plan(s) and Actual Surveys]
"Apply Showing" button: Shows or hides surveys for wells that already have at least one survey showing
"Well" dropdown: Allows you to add to or replace the selection
"Show Geosteer TYPE" button: Display any wells used as a Geosteering Type Well within the project. Note: Geosteering Type Wells are defined in the Geosteering Settings
"Target" button: Makes the selected well the active Target Well
"Show Wells with Formation" dropdown: Lets you select a target formation to show all wells that have a geosteering interpretation using that formation as their target
The "Tops" dropdown option changes the search to find all wells with data for the defined Top
The "Well Target" dropdown option searches for wells with data for the target formation
The "Geosteer" dropdown option searches for wells with a geosteering interpretation target formation
"Show Nearby" button: Allows you to select wells within the defined buffer of the Target Well
In the example, this will display any wells within 500' of any point of the Target Well
"Lateral Only" checkbox: When checked on, ZoneVu will only use the lateral portion of the Target Well to search for nearby wells
Logs Tab:
The Logs tab houses all the log data associated with the Target Well and Type Well(s) [RigStream Logs, .las Logs, & Frac Logs]
Use the checkboxes next to each log curve to turn them on or off in either the Vertical Track (Left checkbox) or Horizontal Track (Right checkbox)
Use the icons at the top of the list to expand or collapse the folders
Use the "Star" icon to make the selected well log curve the favorite for the current mnemonic
Use the "Show empty tracks" checkbox to show tracks that have no curves. Note: Depth tracks are always shown regardless of this setting
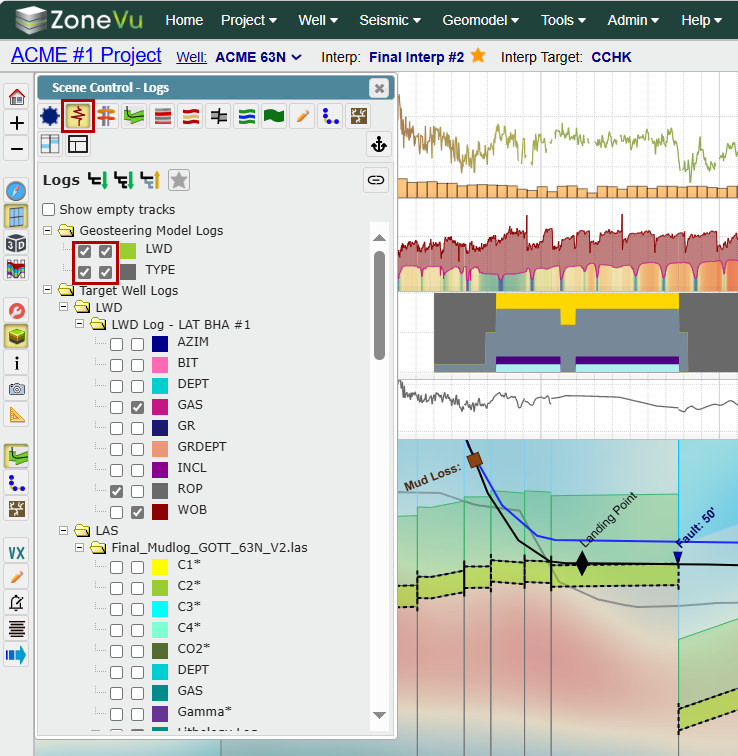
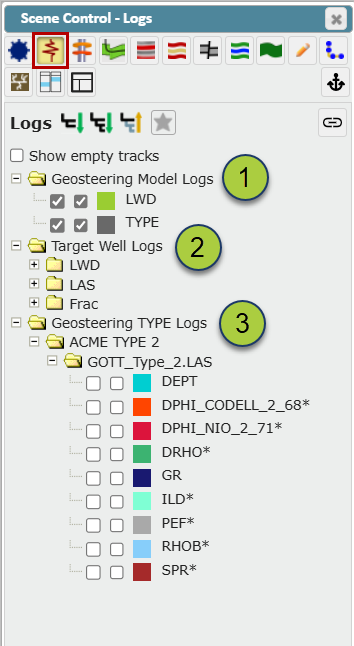
If the Geosteering Module is active, the first set of logs listed will be the Geosteering Model Logs
LWD: Gamma Ray curve assigned to the Target Well. This log is defined in the Geosteering Interpretation Settings
TYPE: Type Gamma Ray Curve. This log is defined in the Geosteering Interpretation Settings
Below the Geosteering Model Logs will be a list of all logs associated with the Target Well (RigStream Logs, .las, and/or Frac Logs)
The next set of logs are the Geosteering TYPE Logs. Here you will see all logs associated with the Type Well(s). Type Logs/Type Wells are defined in the Geosteering Interpretation Settings
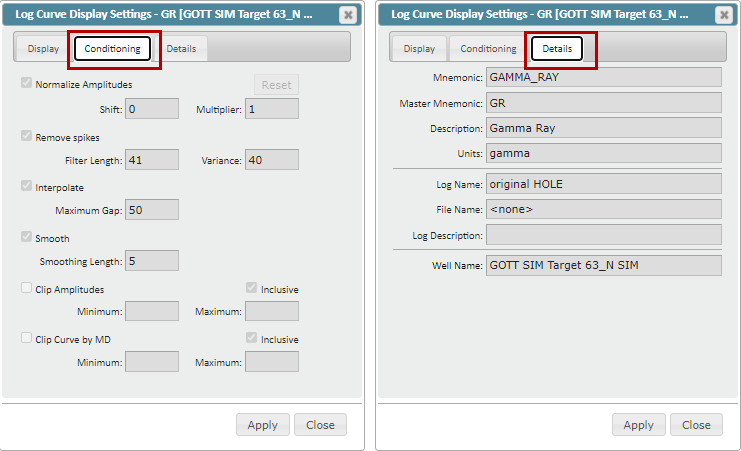
You can access the Log Display Settings by right-clicking on the log name and selecting "Edit Curve Display Settings", or by clicking on the color box next to the Vertical/Horizontal checkboxes. The Log Display Settings dialog contains four tabs:
"Curve" tab: Change the scale, color, line thickness of the log, and fill style
"Histogram" tab: Settings for bins, lines, fill style and color for Horizontal and Vertical tracks
"Conditioning" tab: View, apply, or edit the Log Conditioning parameters (Amplitude Normalization, Despiking, Gap Fill, Smoothing, Amplitude Clipping, Log Clip by MD). Note: Edit Geosteering must be active in order to edit the Logs Conditioning Parameters
"Details" tab: View log information

Tops Tab:
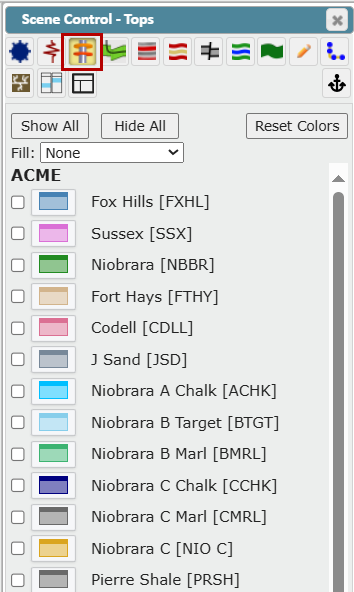
The Tops tab shows all the top data associated with the project
Use the checkboxes to make one or more Top(s) visible on every visible well with data for that Top
Use the "Show All" or "Hide All" button to show or hide all available Top(s)
"Reset Colors" button: Reset the Top(s) display colors to the default color(s) defined in the related Start Column
Use the "Fill" dropdown to select color and texture options
Geosteering Tab:
The Geosteering tab contains display options for geosteering interpretations in the background of the Cross-Section. Note: Geosteering interpretations will be grouped by Geosteering Target, as defined in the Geosteering Interpretation Settings
By default, only geosteering interpretations for the Target Well are displayed. Use the "Show Interpretations for" dropdown to control which interpretations are listed.
Target Well: Lists only the geosteering interpretation for the Target Well
Displayed Wells: Lists the geosteering interpretations for all wells currently displayed in the Cross-Section
All Wells: Lists the geosteering interpretations for all wells in the project
By default, only the Target Zone of the background geosteering interpretation will be displayed. To see the full interpretation, use the "Draw Full Interpretation" checkbox.
Opacity Slider: Controls the opacity of the Geosteering Interpretation(s)
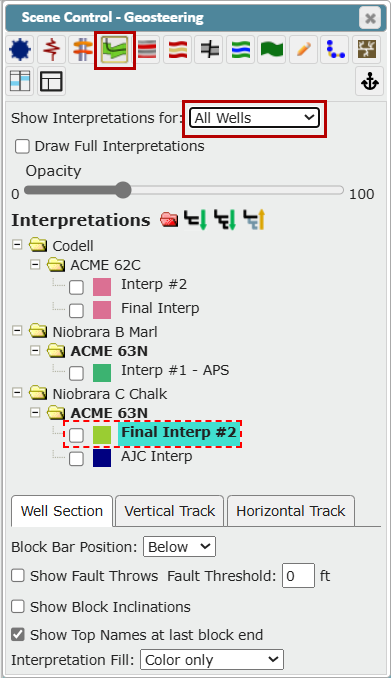
Interpretations
Use the icons at the top of the list to expand or collapse the folders
Use the checkbox next to each Geosteering Interpretation to toggle the Geosteering Interpretation On/Off
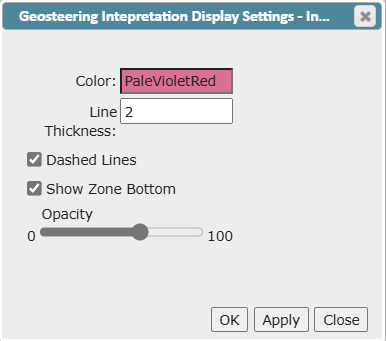
Click on the color box next to the Geosteering Interpretation to access settings that control the Cross-Section background.
Click the Color: field to open a color palette and select a different color
Adjust the Line Thickness if desired
Select whether to use Dashed Lines or Show Zone Bottom
Use the "Opacity" slider to adjust the opacity
Make sure to click the "OK" button to save your changes. Note: This won't change the actual geosteering interpretation, just how it is displayed in the Cross-Section background
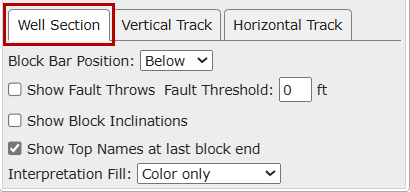
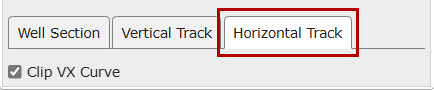
Click the Well Section, Vertical Track or Horizontal Track tabs to access display options for each
Well Section tab
"Block Bar Position" dropdown: Select whether to show the block bar above or below the well section, or hide it
"Show Fault Throws" checkbox: Click to show geosteering fault throws in the 2D scene. Type a value in the Fault Threshold field to establish a threshold
"Show Block Inclinations" checkbox: Select to show geosteering block inclinations in the 2D scene
"Show Top Names at last block end" checkbox: Select to show geosteering top names at the end of the last interpretation's block in the 2D scene
"Interpretation Fill" dropdown: Select an option to fill with the defined color only, defined texture only, or both color and texture
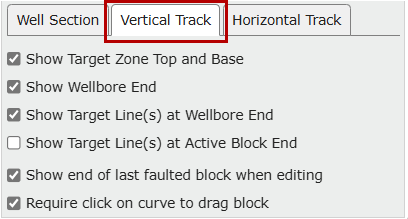
Vertical Track tab
Show Target Zone Top and Base: Select the checkbox to show the geosteer target zone top and base in the vertical track
Show Wellbore End: Select the checkbox to show the last survey station of the actual wellbore in the vertical track, if it is inside the interpretation
Show Target Line(s) at Wellbore End: Select the checkbox to show target line depths at the last survey station of the actual wellbore in the vertical track, if it is inside the interpretation
Show Target Line(s) at Active Block End: Select the checkbox to show target line depths at the end of the active interpretation block in the vertical track
Show end of last faulted block when editing: Select the checkbox to show the end of the last block in the vertical track when editing the interpretation, if there is a fault throw between the active block and the last block
Require click on curve to drag block: De-select the checkbox to allow dragging with a click anywhere between the block ends in the vertical track
Horizontal Track tab
Clip VX Curve: Click the checkbox to clip the curve in the horizontal track to the range of MDs that correspond to the last continuous VX section of the well
Seismic Tab:
This tab allows you to turn on the Wellbore Line and control the appearance of the Seismic Curtain
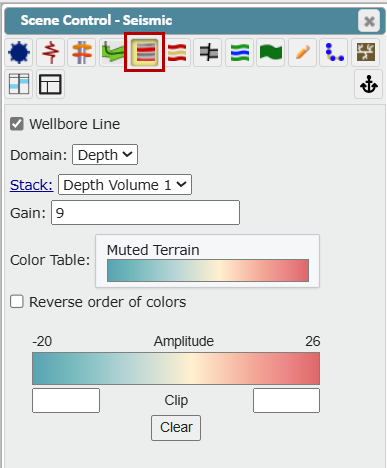
Domain: Select Time or Depth Domain
Note: ZoneVu only supports the use of Depth volumes in the Viewers
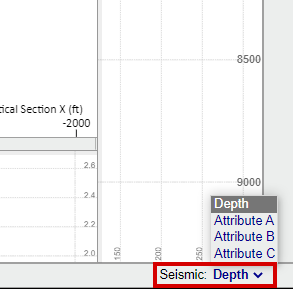
Stack: Toggle between different seismic volumes. You can also use the Seismic dropdown at the bottom right corner of the Viewer
Gain: Adjust the display gain
Color Table: Select the color pallet used to render the seismic data
Amplitude Color Scale: Manually Clip the Seismic amplitudes by inputting a max/min
Note: ZoneVu uses the Well's Actual or Planned Directional Plan to calculate the Horizon(s) intersection points displayed in the 2D viewer
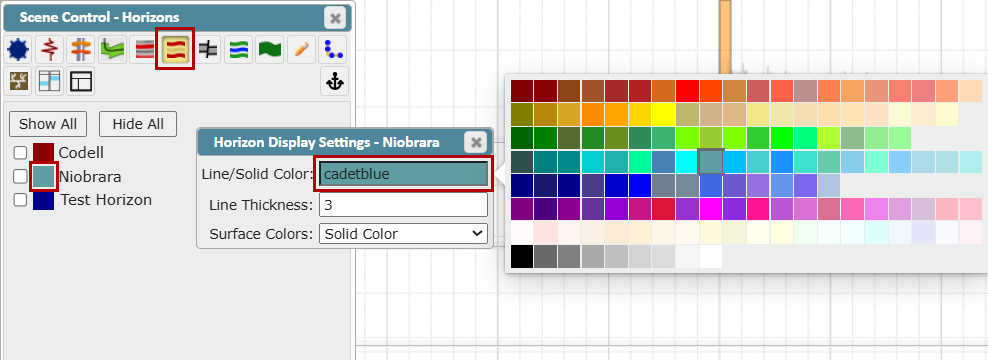
Horizons Tab:
This tab allows you to turn on/off any Seismic Structure Horizon (Structural Grid)
Use the On/Off checkboxes next to the Horizon names to make them visible
Use the "Show All" or "Hide All" button to show or hide all available Horizons
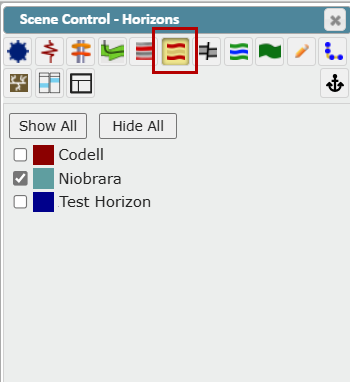
To change the color of a Horizon, click in the Line/Solid Color field to open the color pallet and select a new color. You can also enter the desired Line Thickness in the field provided. Use the Surface Colors dropdown for additional options
Solid Color: Click to open the color selection palette and select a solid color with no shading
Color Gradient: Select to access gradient options for the selected color
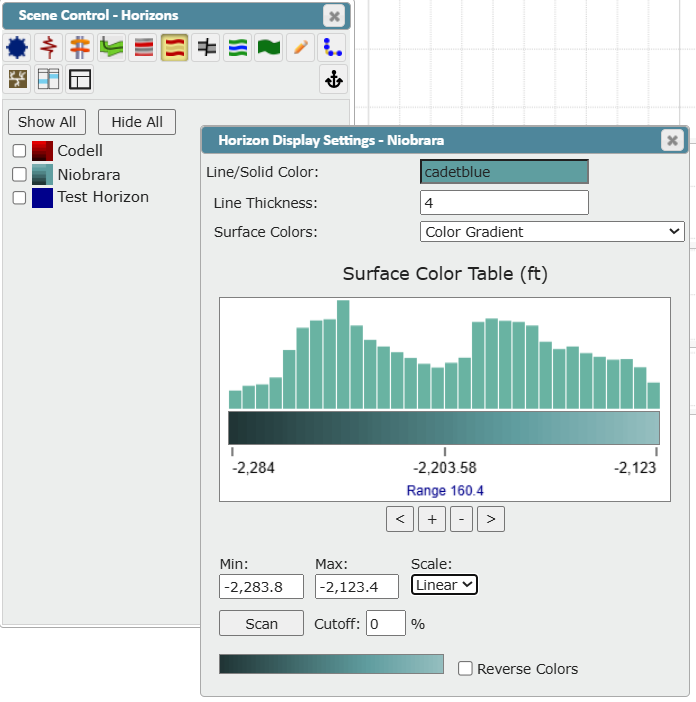
Color Table: Select to access the gradient options with additional Terrain color spectrum settings
Click the "Reverse Colors" checkbox if desired
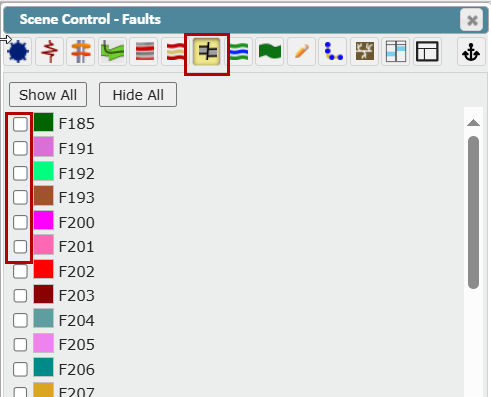
Faults Tab:
This tab allows you to turn on any Faults
Use the On/Off checkboxes to make one or more Faults visible
Use the "Show All" or "Hide All" button to show or hide all available Faults
To change the color of a Fault, click on the color box and select a color from the color pallet pop up
Note: ZoneVu uses the Well's Actual or Planned Directional Plan to calculate the Fault(s) intersection points displayed in the 2D viewer
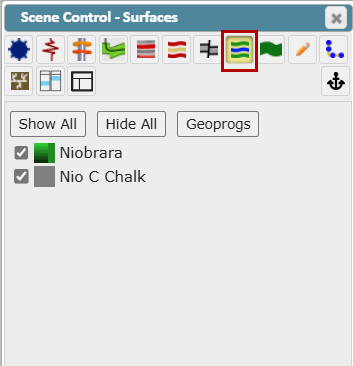
Surfaces Tab:
This tab allows you to turn on any Surfaces. Surfaces are created in ZoneVu by shifting or warping Seismic Structure Horizons in the Geomodel Module.
Use the On/Off check boxes to make one or more Surfaces visible
Use the "Show All" or "Hide All" button to show or hide all available Surfaces
Click the "Geoprogs" button to open the Geoprog Tops window. ZoneVu can auto-pick Geoprog Tops for you based on your Active Well Plans intersection with displayed Structure Grids
Geoprog How-To Article: Geoprog Top Generator
Geomodel How-To Article: Geomodel Creation and Management
To change the color of a Surface, click on the color box (to the left of the Surface name) to open the Structural Surface Display Settings pop up. Click in the Line/Solid Color field to open the color pallet, and then select a new color. You can also enter the desired Line Thickness in the field provided
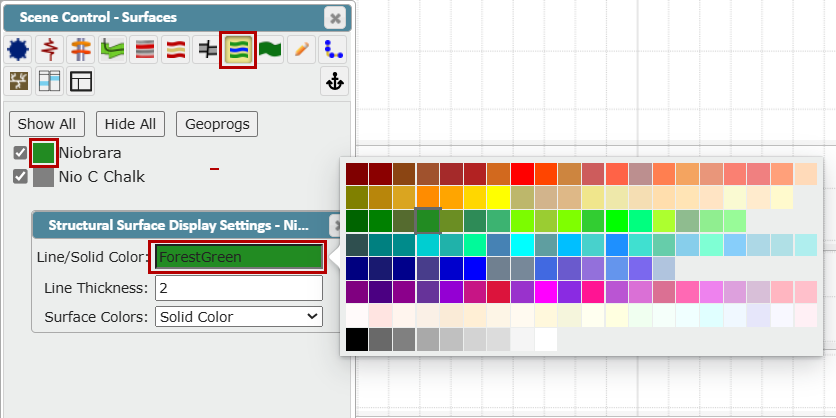
Surface Colors dropdown:
Solid Color: Click to open the color selection palette and select a solid color with no shading (see above)
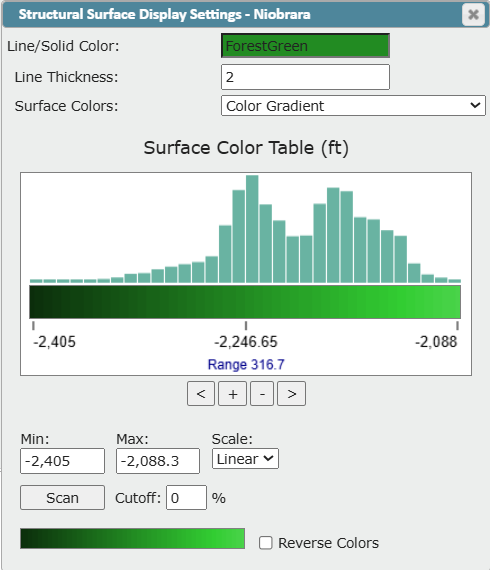
Color Gradient: Select to access gradient options for the selected color
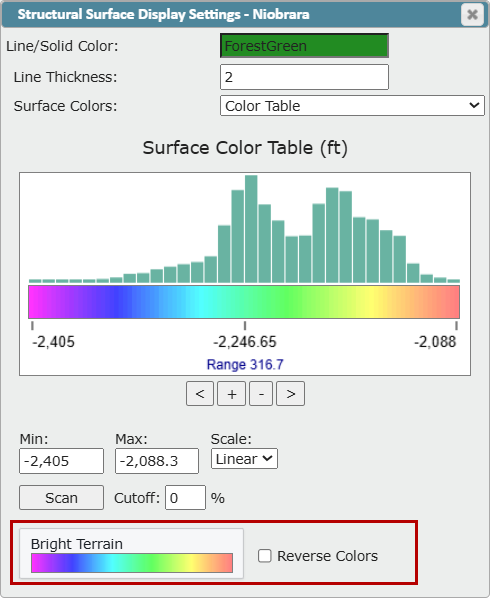
Color Table: Select to access the gradient options with additional Terrain color spectrum settings
Note: ZoneVu uses the Well's Actual or Planned Directional Plan to calculate the Surface(s) intersection points displayed in the 2D viewer
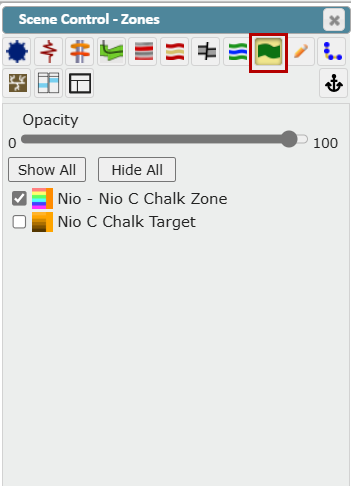
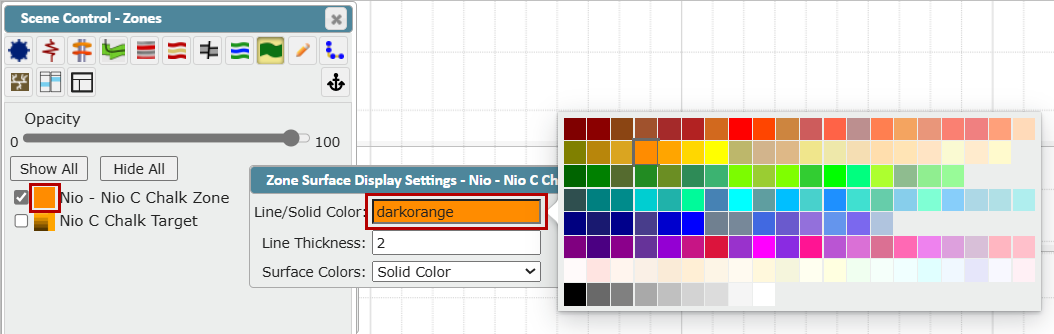
Zones Tab:
This tab allows you to turn on any Zones. Zones are created by shifting, warping, and/or defining a thickness to Seismic Structure Horizons in the Geomodel Module
Use the On/Off checkboxes to make one or more Zones visible
Opacity Slider: Controls the opacity of the Zone(s)
Use the "Show All" or "Hide All" button to show or hide all available Zones
Geomodel How-To Article: Geomodel Creation and Management
To change the color of a Zone, click on the color box to open the Zone Surface Display Settings pop up. Click in the Line/Solid Color field to open the color pallet, and then select a color. You can also enter the desired Line Thickness in the field provided
Surface Colors dropdown: Choose how you want the Surface colored
Solid Color: Click to open the color selection palette and select a solid color with no shading (see above)
Color Gradient: Select to access gradient options for the selected color
Color Table: Select to access the gradient options with additional Terrain color spectrum settings
Note: ZoneVu uses the Well's Actual or Planned Directional Plan to calculate the Zone(s) intersection points displayed in the 2D viewer
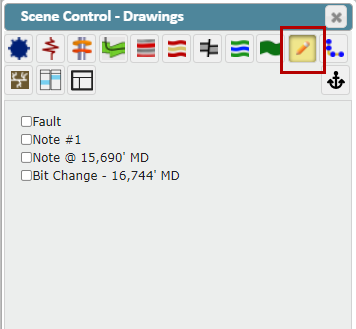
Drawings Tab:
This tab allows you to turn on any Annotation(s) or Drawing(s). Use the checkboxes to make any existing Drawings visible or hidden
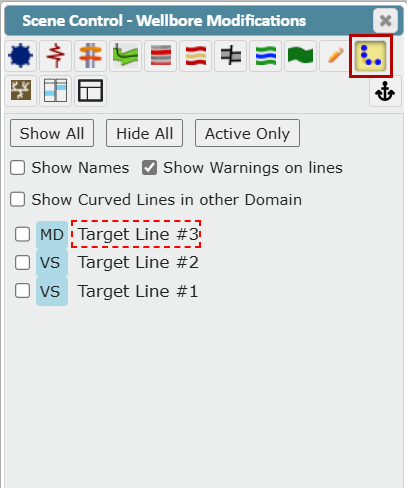
Wellbore Modifications Tab:
This tab allows you to control the display of target lines in the cross-section
Use the "Show All" or "Hide All" button to show or hide all available target lines
Use the "Active Only" button to show only the active target line
Use the "Show Names" checkbox to turn on/off the target line name in the cross-section
Use the "Show Warnings on lines" checkbox to turn on/off warnings in the cross-section.
Use the "Show Curved Lines in other Domain" checkbox to turn on/off curved lines in another domain (MD or VS/VX)
Use the On/Off checkboxes to make one or more in target lines visible.
The Horizontal Scale (MD or VS/VX) a target line was drawn in and is tied to will be listed and displayed in the Scene
If a target line was created prior to August 2024, a warning will display to alert the User that the domain (horizontal scale) for this target line has not been set. Go to Wellbore Modifications Settings to assign it to a domain
Fracs Tab:
This tab allows you to turn on Fracs and control their appearance.
Use the icons at the top of the list to expand or collapse the folders
Use the On/Off checkboxes to make one or more Frac Plans visible
Use the "Hide" button to hide all available Fracs
Use the "Show Fracs" dropdown to select the option to show starred Fracs, Frac Plans, or Frac Jobs
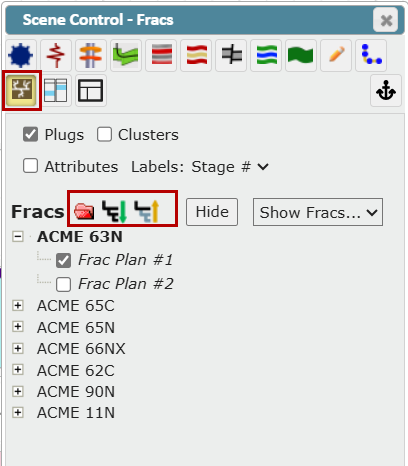
Use the "Plugs" checkbox to display Plugs
Use the "Clusters" checkbox to display Clusters
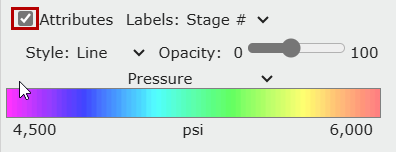
Use the "Attributes" checkbox to see options that control the appearance of the Frac
Select a Stage from the "Labels" dropdown (Stage # or Attribute)
Use the "Style" dropdown to select Line or Bubble style
Use the "Opacity" slider to control the opacity
Use the Attribute dropdown to select from a list including Pressure, ScreenedOut, Slurry Rate, etc...
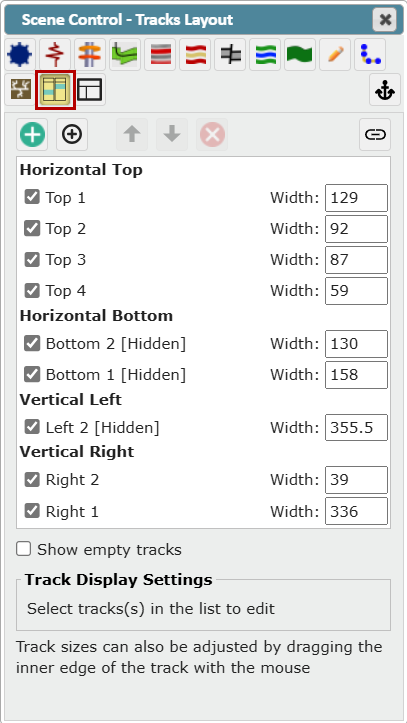
Tracks Layout Tab:
This tab allows you to control the appearance of the tracks. Both the horizontal and vertical log tracks are fully customizable. Logs can be added, removed, and resized, and new log tracks can be stacked at the top and left side of the screen, or next to the existing log tracks
Use the larger plus sign button (white on green background) to add a new Track, and the smaller plus sign button (black on grey background) to add depth/a label track to a Track
Click the link icon on the right to couple or decouple the vertical log tracks to the wellbore
Type a value in the "Width" field to change the size of the track. Note: Tracks can also be resized by dragging the inner edge of the track with the mouse
Click the "Show empty tracks" checkbox to display empty tracks in the viewer
To further customize a track, select the track on the list. The Up, Down and Delete buttons become active, and the Track Display Settings open below.
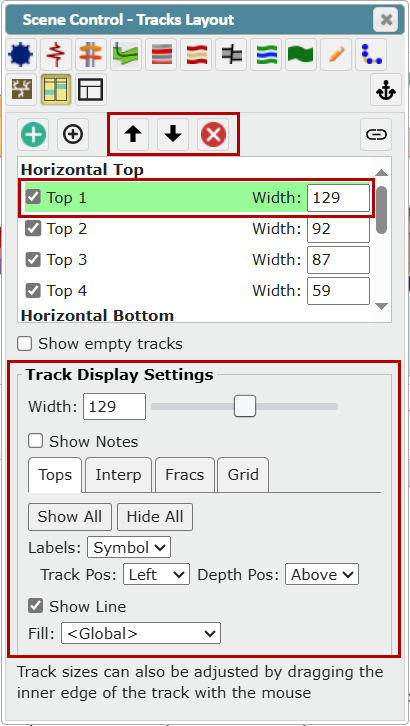
Type a value in the "Width" field to change the size of the track. Your can also drag the slider to the right or the left to increase or decrease the width. Note: Tracks can also be resized by dragging the inner edge of the track with the mouse
Click the "Show Notes" checkbox to display any User Notes on the track
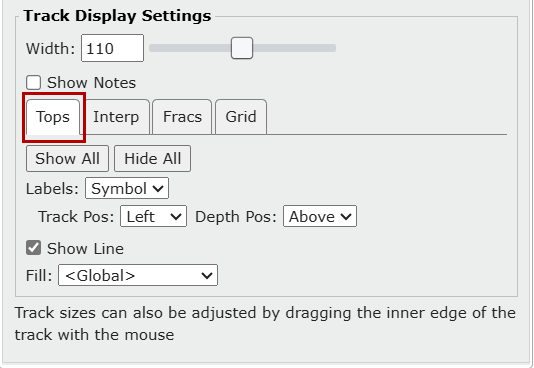
Tops tab: Click this tab to access the Track Tops display settings
"Show All" button: Turns on all Top types in the track
"Hide All" button: Turns off all Top types in the track
Labels: Controls the display of Top labels for Top lines in the track. Select Single, Depth or None
Track Pos: Controls the position of Top labels across the track in the same axis as curve amplitudes. Select Left or Right
Depth Pos: Controls the position of Top labels along the track in the same axis as curve amplitudes. Select Above, On or Below
"Show Line" checkbox: Controls the visibility of the top line in the track
"Fill" dropdown: Controls the fill type of the Top. Select None, Color only, Texture only or Color and Texture
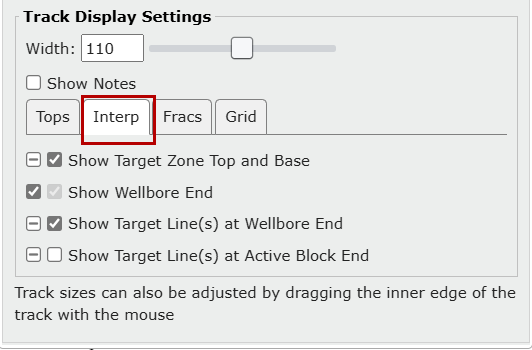
Interp tab: Click this tab to access the Interpretation display settings
Use the first checkbox (on the left) to override the inherited setting for each option. A horizontal line in this checkbox means that the inherited setting is in use. Keep it unchecked to use the inherited setting
Click the second checkbox (on the right) to use the inherited setting
"Show Target Zone Top and Base" checkbox: Show the geosteer target zone and base in the vertical track
"Show Wellbore End" checkbox: Show the last survey station of the Actual wellbore in the vertical track, if it is inside the interpretation
"Show Target Line(s) at Wellbore End" checkbox: Show target line depth(s) of the last survey station of the Actual wellbore in the vertical track, if it is inside the interpretation
"Show Target Line(s) at Active Block End" checkbox: Show target line depth(s) at the end of the active interpretation block in the vertical track
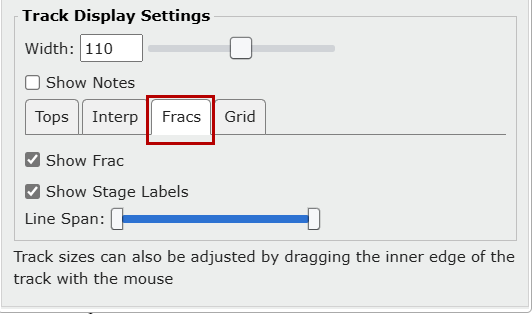
Fracs tab: Click this tab to access the Track frac display settings
Click the "Show Frac" checkbox to control the visibility of frac stages, plugs and clusters in the track
Click the "Show Stage Labels" checkbox to control the visibility of frac stage labels in the track
Use the "Line Span" slider to control the extent of frac and cluster lines across the track
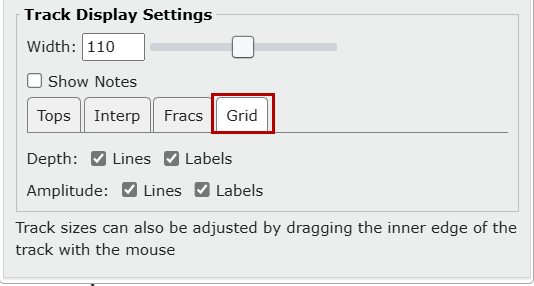
Grid tab: Click this tab to access the grid display settings
"Depth" and "Amplitude": Use the "Lines" and "Labels" checkboxes to show or hide grid lines and grid labels in the track
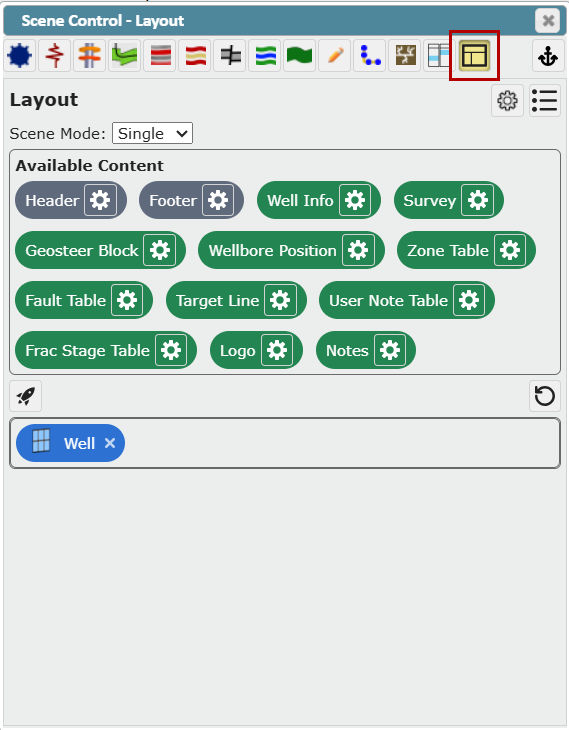
Layout Tab:
The Layout tab in Scene Control allows you to create a custom layout or tabbed layout. In these Layouts, you can dock multiple viewers or data widgets to create the custom displays. Click here to go to the Help article
Layout Tab How-To Article: Creating a Custom Viewer Layout