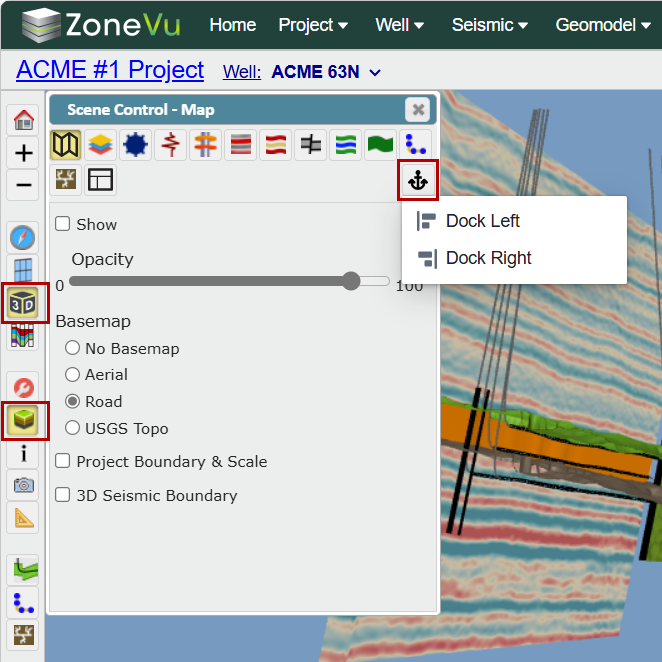
While in the 3D Viewer, open the Scene Control pop-up by clicking the Scene Control button in the left vertical tool bar
You can move the Scene Control pop-up around on the Viewer by clicking and dragging the top blue border
Use the "Anchor" button to dock the Scene Control pop-up, on either the left or right side of the Viewer

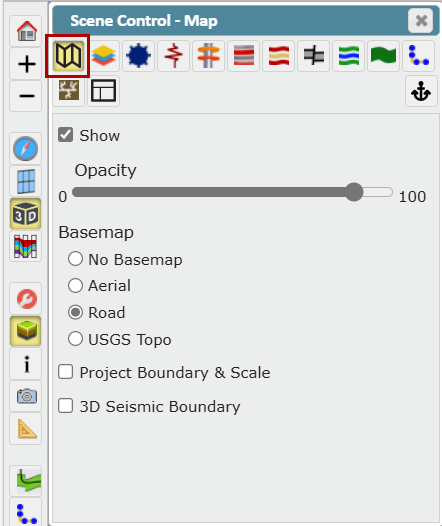
Map Tab:
The Map tab allows you to control the imagery and boundaries displayed on the top of the 3D Cube
"Show" checkbox: Toggles the Map On/Off
Opacity Slider: Controls the opacity of the Map
BaseMap: Choose which Basemap background is used
No Basemap: Grey background
Aerial: Bing Maps aerial imagery
Road: Bing Maps basic map display
USGS Topo: USGS Topo map
"Project Boundary & Scale" checkbox: Toggle Project Boundaries and Scale On/Off
"3D Seismic Boundary" checkbox: Toggle 3D Seismic Boundaries On/Off
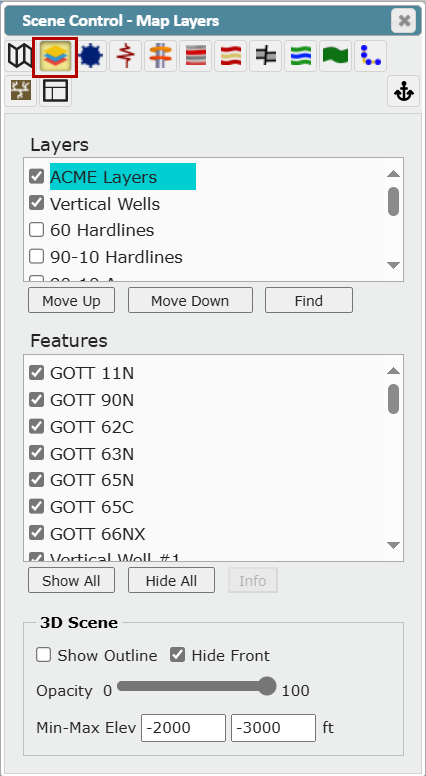
Map Layers Tab:
The Layers tab allows you to control which Layers are visible and change how they are displayed in the 3D Cube.
The Layers section displays every layer loaded into the Project, listed in their rendering order (objects at the top of the list will be rendered on top of the layers below them)
Use the "Move Up" or "Move Down" to adjust the selected Layer's position in the rendering order
The "Find" button will zoom to the selected Layer or Feature
The Features section displays all the features that make up the selected Layer
Use the "Show All" or "Hide All" to turn all the Features On/Off
The "Info" button will open a pop-up that will list all of the feature's parameters (Name/Value Pairs)
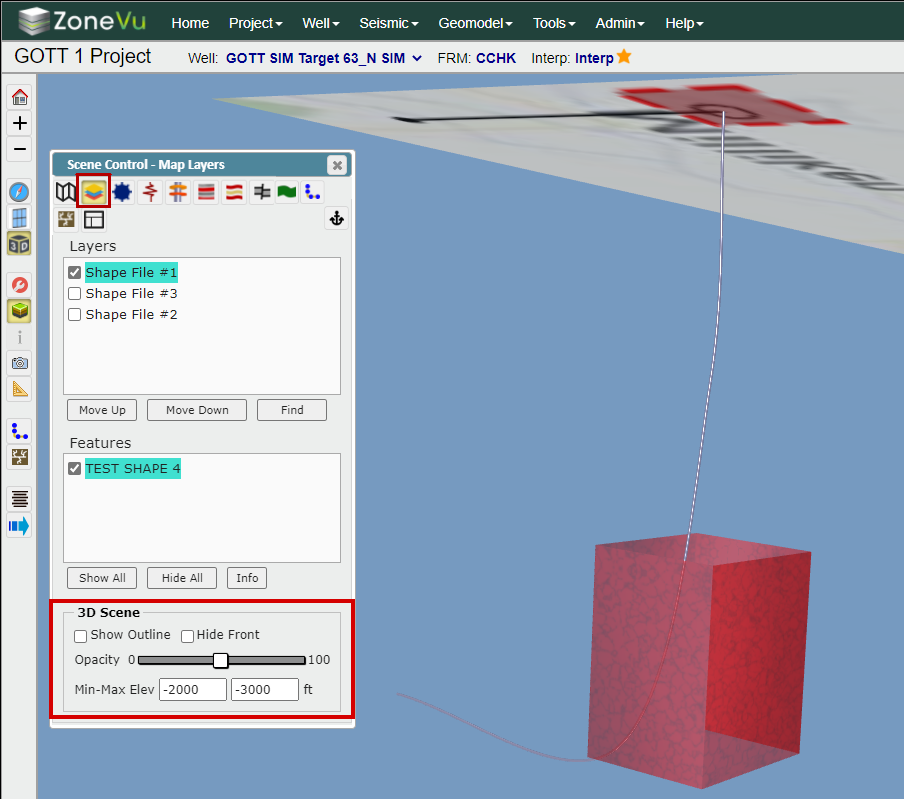
The 3D Scene section controls how all visible Layers/Features are displayed in the 3D Cube
"Show Outline" checkbox: Project the boundary lines for all visible Layers & Features down into the 3D Cube
"Hide Front" checkbox: When checked on, ZoneVu will hide the front side of all visible Layers & Features allowing you to view into the projected objects
Opacity Slider: This allows you to control the opacity of the visible Layers & Features
"Min-Max Elev" boxes: Controls the elevation depths the visible Layers & Features are displayed at
In the example below, all visible Layers & Features will only be displayed from -2000 to -3000 ft in the 3D Cube
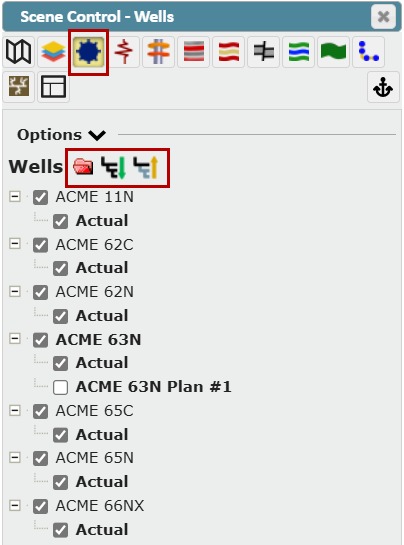
Wells Tab:
The Wells tab controls the display of all wells loaded into the project. Nested under the well name you will see all the Directional Surveys [Plan(s) & Actual]. Use the checkbox to toggle the plan(s) On/Off
Use the Folder icons to expand or collapse the folders
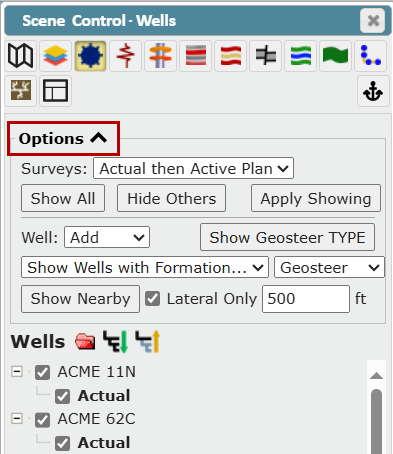
Clicking the "Options" button opens the advanced search and display functionality for wells
"Show Surveys" dropdown: Bulk select or deselect available deviation plan(s) and/or actual
All Surveys: Turns on all Actual and Plan Deviation surveys for all wells
Actual then Active Plan: Turns on all Actual Surveys only for each well. If the well does not have an Actual Survey, ZoneVu will display the default Plan Survey
Actual Only: Turns on only the Actual Survey(s)
Active Plan Only: Turns on only the Plan Survey(s)
"All Plans": Turns on all Plan Survey(s)
"Show All" button: Turns on all wells in the project [Plan(s) and Actual Surveys]
"Hide All" button: Turns off all non-Active wells in the project [Plan(s) and Actual Surveys]
"Apply Showing" button: Shows or hides surveys for wells that already have at least one survey showing
"Well" drop down: Use to add to the selection or replace the selection
"Show Geosteer TYPE" button: Shows or hides surveys for all Type wells used in the current geosteering interpretation
Geosteering Type Wells are defined in the Geosteering Settings
"Show Wells with Formation" dropdown: Select a Formation from the list to show all wells that have a geosteering interpretation using that formation as a target
Tops: Refine by wells with formation tops
Well: Refine by wells with target formation
Geosteer: Refine by wells that have a geosteering target formation
"Show Nearby" button: Select wells within a defined buffer of the Active Well
"Lateral Only" checkbox: When selected, ZoneVu will only use the lateral portion of the Active Well to search for nearby wells
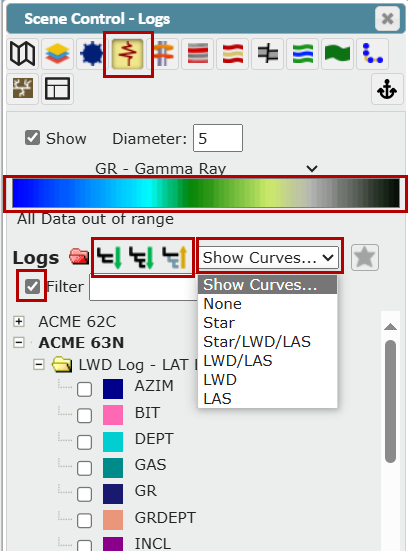
Logs Tab:
The Logs tab allows you to color and scale displayed wellbores using a log curve selection
"Show" checkbox: Toggles the log coloring/scaling on or off in the viewer
"Diameter" field: Scales the wellbore diameter by the log values
"Curve" dropdown: Use the dropdown to select the log used to color and/or scale the wellbore(s)
Use the "Folder" icons to expand or collapse the Logs folders
Click the "Filter" checkbox and then type a value in the field by which to filter the logs
Use the "Show Curves" drop down to select which curves to display in the viewer
Click the "Star" button to make the selected well log curve the favorite for the current mnemonic (or to de-select it)
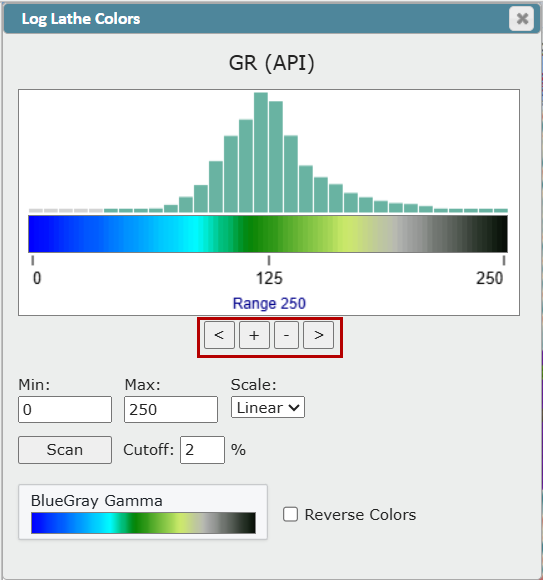
For the selected Curve, click the gradient field to choose and refine the color gradient. This opens the Log Lathe Colors window
Use the arrows and plus/minus buttons to adjust the range, or you can type a Min & Max value in the fields provided
"Scale" dropdown: Select between Linear and Logarithmic log scales
"Scan" button: Scans
"Cutout" input: Allows you to control what percent of extraneous values you want to be ignored
At the bottom, you can see the name of your color selection which you can change by clicking the box and selecting a different one
Click the "Reverse Colors" checkbox if desired
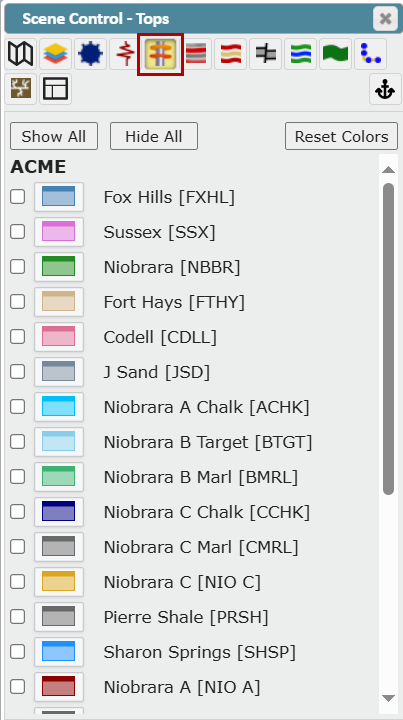
Tops Tab:
This tab shows all the top data associated with the project
Use the On/Off checkboxes to make one or more Top(s) visible on every visible well with data for that Top
Use the "Show All" or "Hide All" button to show or hide all available Top(s)
"Reset Colors" button: Resets the Top(s) display colors to the default color(s) defined in the related Strat Column
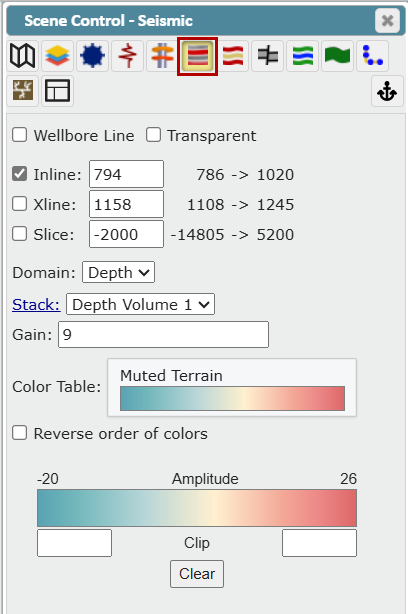
Seismic Tab:
This tab allows you to display seismic data loaded in the project
Wellbore Line: Toggles the Active Well's Seismic Curtain On/Off
ZoneVu by default will use the Actual Deviation Survey to calculate the Seismic Curtain. If the well does not have an Actual Deviation Survey, then the Default Plan will be used
When a Well is drilling live, ZoneVu will use the Well's Plan Deviation Survey to calculate the Seismic Curtain, but as Actual Survey Stations come in ZoneVu updates the Seismic Curtain with the Actual Survey Stations
When a new Active Well is chosen, ZoneVu will automatically update the Wellbore Line
Transparent: Makes the Seismic data semi-transparent
Inline: Shows the defined inline
Xline: Show the defined Crossline
Slice: Shows the defined depth slice
Domain: Select Time or Depth Domain
Note: ZoneVu only supports the use of Depth volumes in the Viewers
Stack: Click to open the Seismic folder in a new tab. Use the dropdown to switch between different Seismic Volumes
Note: You can also use the dropdown in the lower right corner of the viewer
Gain: Adjust the display gain
Color Table: Click to select the color pallet used to render the seismic data. Click the checkbox to reverse the order of colors
Amplitude Color Scale: Manually Clip the Seismic amplitudes by inputting a max/min
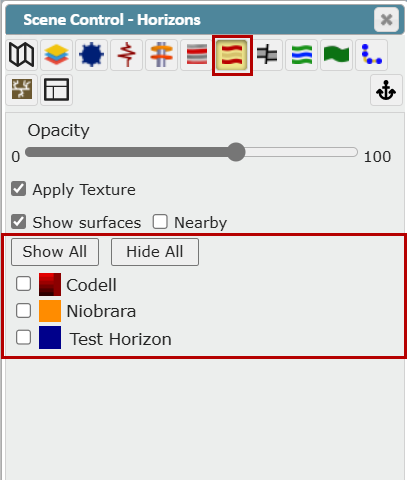
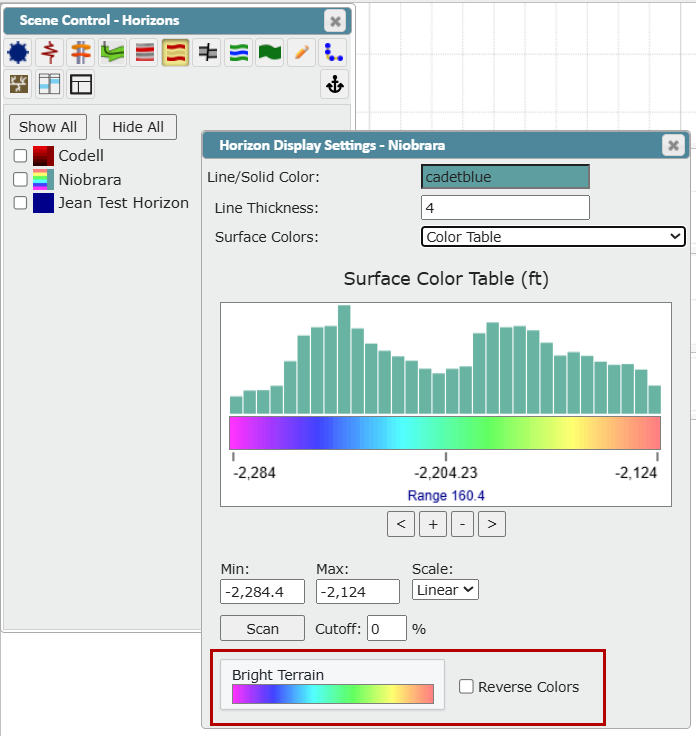
Horizons Tab:
This tab allows you to turn on/off any Seismic Structure Horizon (Structural Grid)
Use the On/Off checkboxes next to the Horizon names to make them visible
Use the "Show All" or "Hide All" button to show or hide all available Horizons
"Opacity Slider": Controls the opacity of the Horizon(s)
"Apply Texture" checkbox: Renders a 3D texture onto the displayed Horizon(s)
"Show Surfaces" checkbox: Controls if any visible Horizons are rendered
"Nearby" checkbox: When checked on, the Zone will only be displayed around the Active Well
To change the color of a Horizon, click in the Line/Solid Color field to open the color pallet and select a new color. You can also enter the desired Line Thickness in the field provided. Use the Surface Colors dropdown for additional options
Solid Color: Click to open the color selection palette and select a solid color with no shading
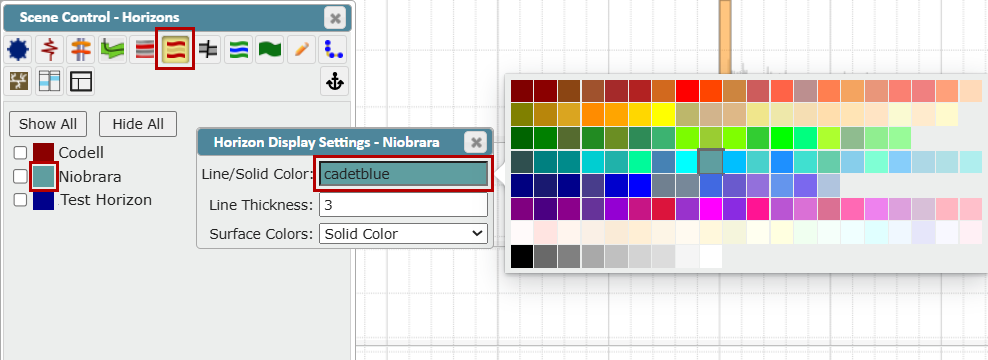
Color Gradient: Select to access gradient options for the selected color
Color Table: Select to access the gradient options with additional Terrain color spectrum settings
Click the "Reverse Colors" checkbox if desired
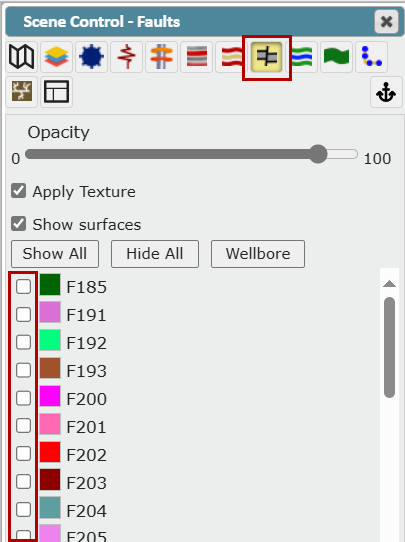
Faults Tab:
This tab allows you to turn on any Fault(s)
Use the On/Off checkboxes to make one or more Fault(s) visible
Opacity Slider: Controls the opacity of the Fault(s)
"Apply Texture" checkbox: Renders a 3D texture onto the displayed Fault(s)
"Show Surfaces" checkbox: Controls if any visible Faults are rendered
"Wellbore" button: Displays all Fault Surfaces that intersect the Active Well
Use the "Show All" or "Hide All" button to show or hide all available Faults
To change the color of a Fault, click in the Line/Solid Color field to open the color pallet and select a new color.
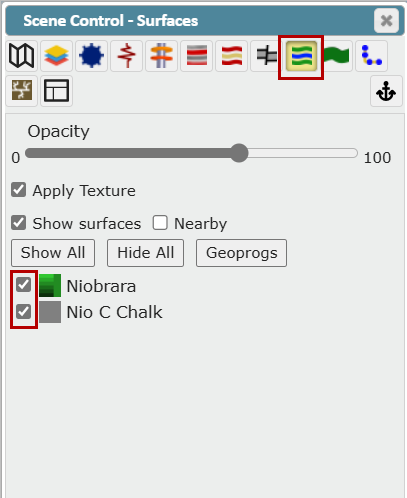
Surfaces Tab:
This tab allows you to turn on/off any Surface(s)
Use the On/Off checkboxes to make one or more Surfaces visible
To change the color, click on the color box to the left of the name to open the Structural Surface Display Settings pop up
Opacity Slider: Controls the opacity for the Surface(s)
"Apply Texture" checkbox: Renders a 3D texture onto the displayed Surface(s)
"Show Surfaces" checkbox: Controls if any visible Surfaces are rendered
"Nearby Only" checkbox: When checked on, the Zone will only be displayed around the Active Well
Use the "Show All" or "Hide All" button to show or hide all available Surfaces
Click the "Geoprogs" button to open the Geoprog Generator window where you can auto-pick Geoprog tops using the intersection points of the Active Well Plan and Displayed Structural Surfaces
To change the color of a Surface, click in the Line/Solid Color field to open the color pallet and select a new color. You can also enter the desired Line Thickness in the field provided. Use the Surface Colors dropdown for additional options
Note: Surfaces are created in ZoneVu by shifting or warping Seismic Structure Horizons in the Geomodel Module.
Geomodel How-To Article: Geomodel Creation and Management
Geoprog How-To-Article: Geoprog Top Generator
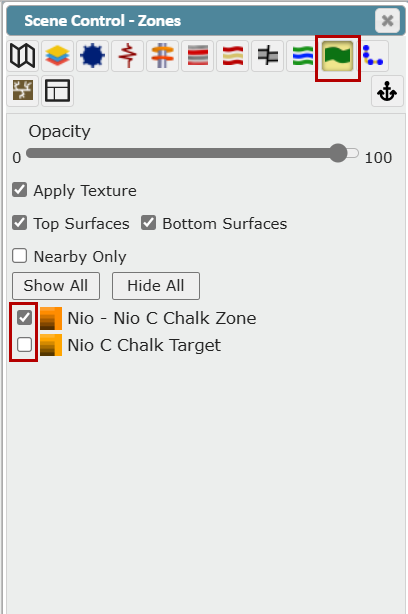
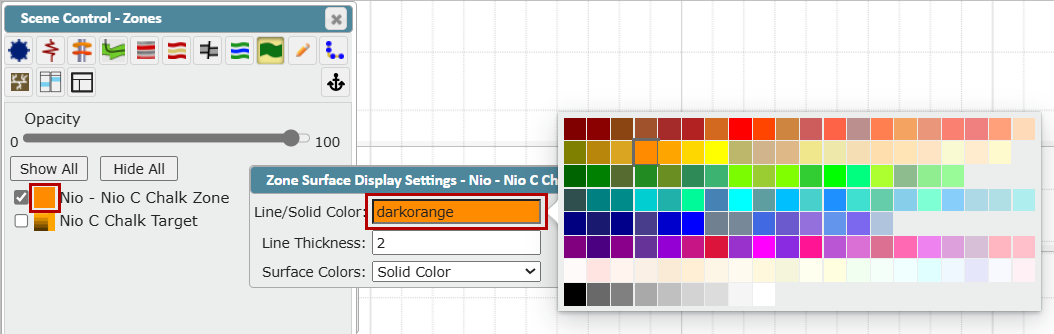
Zones Tab:
This tab allows you to turn on any Zones
Use the On/Off checkboxes to make one or more Zones visible
To change the color, click on the color box to the left of the name to open the Zone Surface Display Settings pop up
Opacity Slider: This allows you to control the opacity for the Zone(s)
"Apply Texture" checkbox: Renders a 3D texture onto the displayed Zone(s)
"Top Surface" and "Bottom Surface" checkboxes: Displays the Top of the Zone, the Base of the Zone, or both
"Nearby Only" checkbox: When checked on, the Zone will only be displayed around the Active Well
Use the "Show All" or "Hide All" button to show or hide all available Zones
To change the color of a Zone, click on the color box to open the Zone Surface Display Settings pop up. Click in the Line/Solid Color field to open the color pallet, and then select a color. You can also enter the desired Line Thickness in the field provided
Surface Colors dropdown: Choose how you want the Surface colored
Solid Color: Click to open the color selection palette and select a solid color with no shading (see above)
Color Gradient: Select to access gradient options for the selected color
Color Table: Select to access the gradient options with additional Terrain color spectrum settings
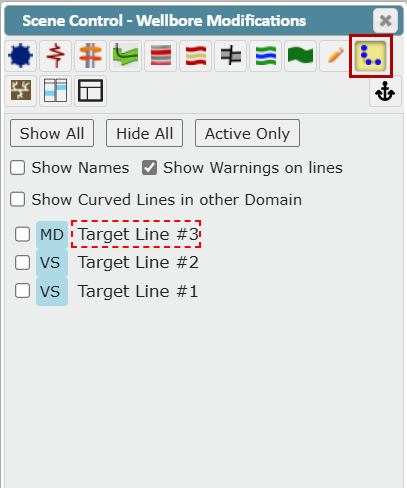
Wellbore Modifications Tab:
This tab allows you to control the display of target lines in the cross-section
Use the "Show All" or "Hide All" button to show or hide all available target lines
Use the "Active Only" button to show only the active target line
Use the "Show Names" checkbox to turn on/off the target line name in the cross-section
Use the "Show Warnings on lines" checkbox to turn on/off warnings in the cross-section.
Use the "Show Curved Lines in other Domain" checkbox to turn on/off curved lines in another domain (MD or VS/VX)
Use the On/Off checkboxes to make one or more in target lines visible.
The Horizontal Scale (MD or VS/VX) a target line was drawn in and is tied to will be listed and displayed in the Scene
If a target line was created prior to August 2024, a warning will display to alert the User that the domain (horizontal scale) for this target line has not been set. Go to Wellbore Modifications Settings to assign it to a domain
Fracs Tab:
This tab allows you to turn on Fracs and control their appearance.
Use the icons at the top of the list to expand or collapse the folders
Use the On/Off checkboxes to make one or more Frac Plans visible
Use the "Hide" button to hide all available Fracs
Use the "Show Fracs" dropdown to select the option to show starred Fracs, Frac Plans, or Frac Jobs
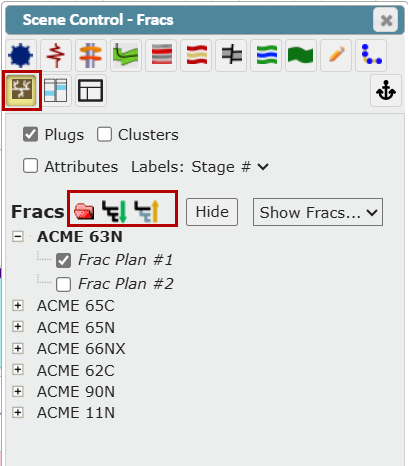
Use the "Plugs" checkbox to display Plugs
Use the "Clusters" checkbox to display Clusters
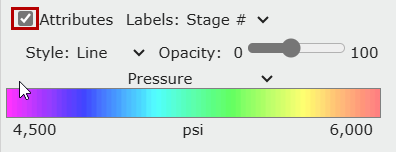
Use the "Attributes" checkbox to see options that control the appearance of the Frac
Select a Stage from the "Labels" dropdown (Stage # or Attribute)
Use the "Style" dropdown to select Line or Bubble style
Use the "Opacity" slider to control the opacity
Use the Attribute dropdown to select from a list including Pressure, ScreenedOut, Slurry Rate, etc...
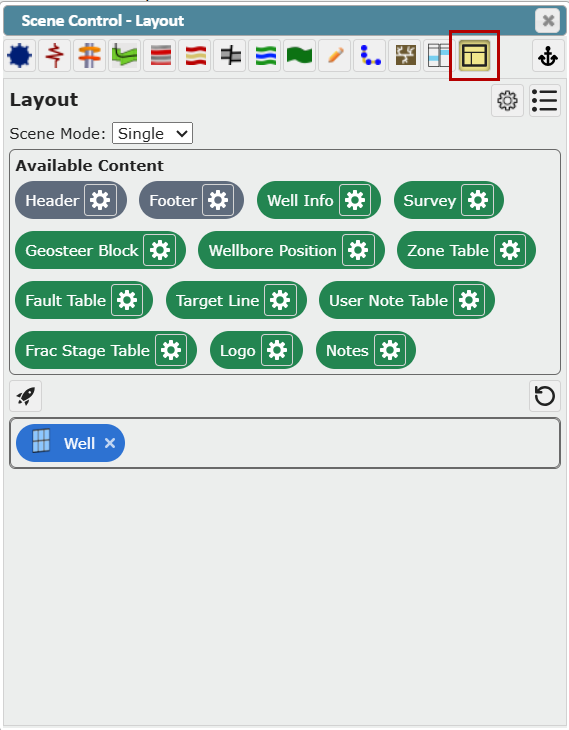
Layout Tab:
The Layout tab in Scene Control allows you to create a custom layout or tabbed layout. In these Layouts, you can dock multiple viewers or data widgets to create the custom displays. Click here to go to the Help article
Layout Tab How-To Article: Creating a Custom Viewer Layout