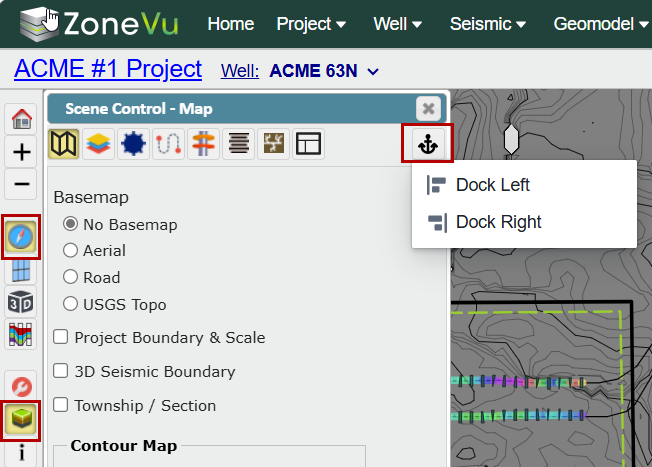
While in the Map Viewer, open the Scene Control pop-up by clicking the Scene Control button in the left vertical tool bar
You can move the Scene Control pop-up around on the Viewer by clicking and dragging the top blue border
Use the "Anchor" button to dock the Scene Control pop-up, on either the left or right side of the Viewer
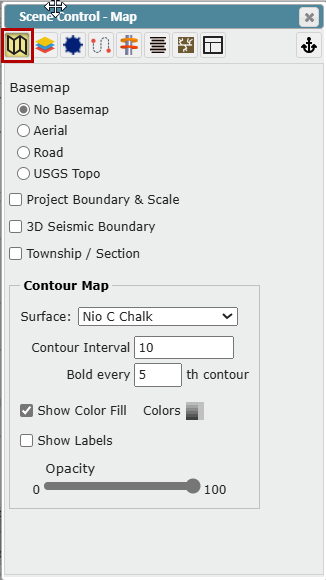
Map Tab:
The Map Tab allows you to control the Basemap, Project/Seismic boundaries, select Contour Map(s), and adjust the Contour Map display properties
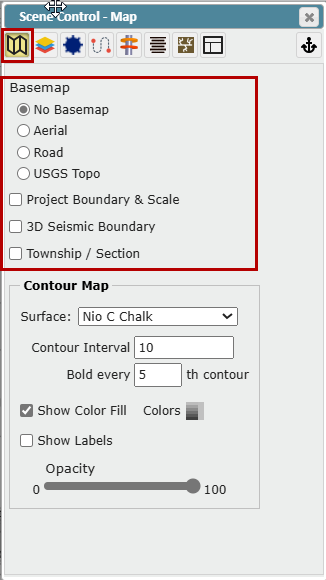
Controlling the Basemap:
BaseMap: Choose which Basemap background is used
No Basemap: Grey background
Aerial: Bing Maps aerial imagery
Road: Bing Maps basic map display
USGS Topo: USGS Topo map
"Project Boundary & Scale" checkbox: Toggle Project Boundaries and Scale on/off
"3D Seismic Boundary" checkbox: Toggle 3D Seismic Volume Boundaries on/off
"Township/Section" checkbox: Toggle State Township & Range and Section boundaries on/off
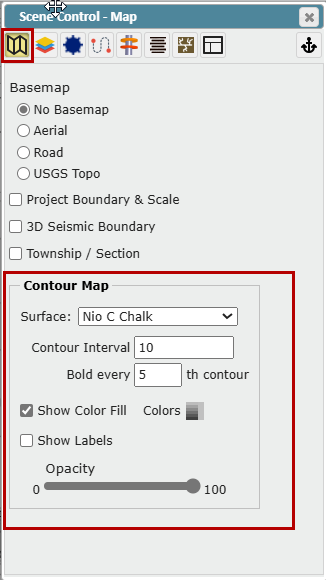
Contour Map:
Surface: Dropdown listing all Structural Surfaces, Seismic Horizons and Data Grids available for display
Contour Interval: Specify the contour interval
Bold every Nth Contour: Specify major Contour every Nth contour
"Show Color Fill" checkbox: Toggle Surface color fill On/Off
"Show Labels" checkbox: Toggle Contour labeling On/Off
Opacity Slider: Controls the color fill, contour, and contour labeling opacity
Colors: Defined Color Fill (see below)
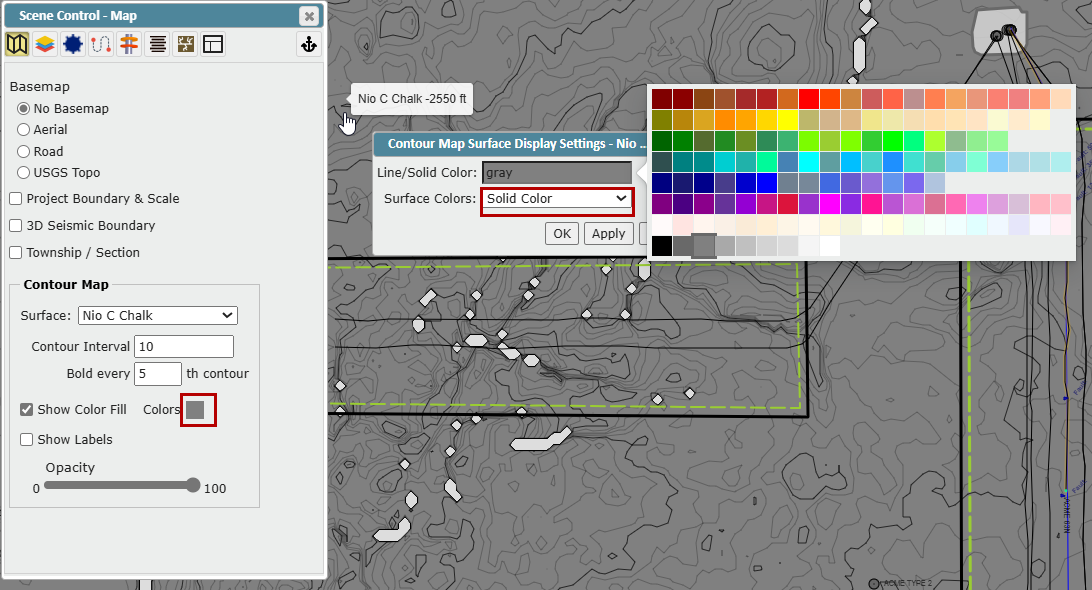
To change the color of the Contour Map, click on the Colors box to open the Contour Map Surface Display Settings, and select an option from the Surface Colors dropdown
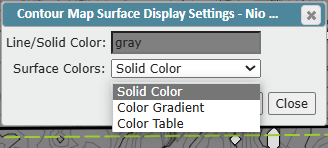
Solid Color: Click to open the color selection table and select a solid color with no shading
Color Gradient: Select to access gradient options
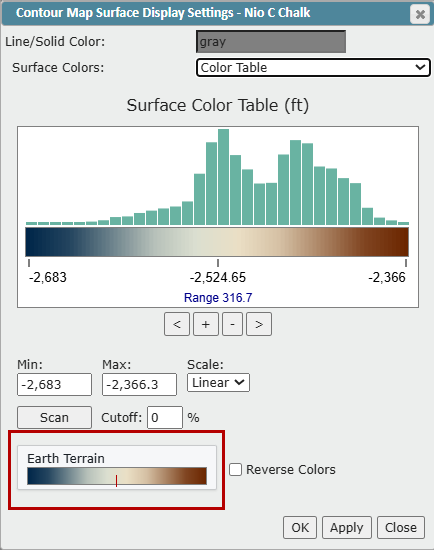
Color Table: Select to access the gradient options with additional Terrain color spectrum settings
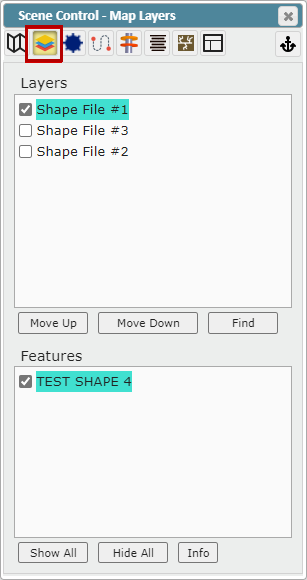
Layers Tab:
The Layers tab allows you to control which Layers are visible and change the rendering order
Layers Window: Displays all available layers and their rendering order
Use the checkbox to toggle the layer On/Off
Layers at the top of the list plot over lower layers
"Move Up" button: Moves selected layer up in the rendering order
"Move Down" button: Moves selected layer down in the rendering order
"Find" button: Locates the layer on the map
Features Window: Displays all polygons/polylines/points within the selected layer
"Show All" button: Turns all layer features on
"Hide All" button: Turns all layer features on
"Info" button: Brings up the Info pop-up that shows all of the features information
Wells Tab:
The Wells tab controls the display of all wells loaded into the project. Nested under the well name you will see all the Directional Surveys [Plan(s) & Actual]. Use the checkbox to toggle the plan(s) On/Off
"Show Stations" checkbox: Toggles survey station markers On/Off
Survey station diameter will decrease as stations start to overlap in Map View
"Labels" checkbox: Displays labels
Use the Folder icons to expand or collapse the folders
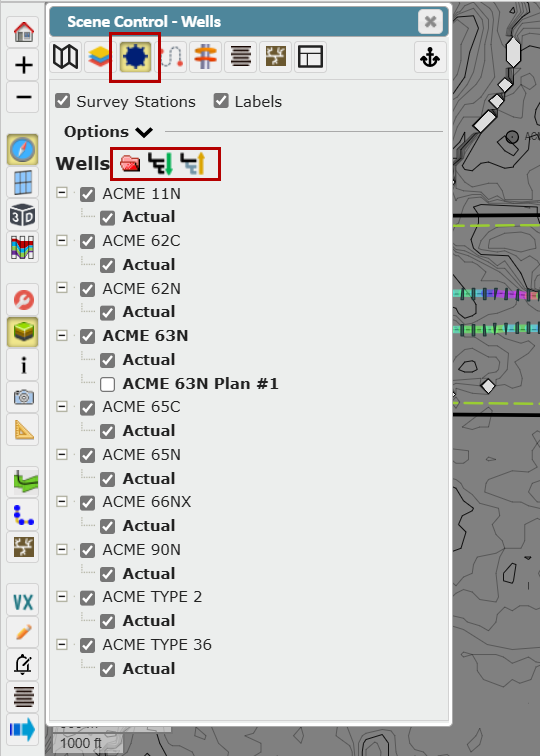
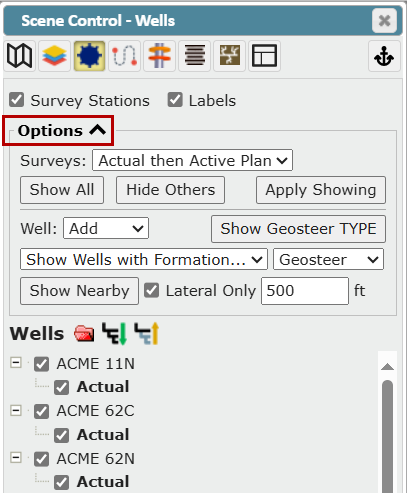
Clicking the "Options" button will open the advanced search and display functionality for wells
"Show Surveys" dropdown: Bulk select or deselect available deviation plan(s) and/or actual
All Surveys: Turns on all Actual and Plan Deviation surveys for all wells
Actual then Active Plan: Turns on all Actual Surveys only for each well. If the well does not have an Actual Survey, ZoneVu will display the default Plan Survey
Actual Only: Turns on only the Actual Survey(s)
Active Plan Only: Turns on only the Plan Survey(s)
"All Plans": Turns on all Plan Survey(s)
"Show All" button: Turns on all wells in the project [Plan(s) and Actual Surveys]
"Hide All" button: Turns off all non-Active wells in the project [Plan(s) and Actual Surveys]
"Apply Showing" button: Shows or hides surveys for wells that already have at least one survey showing
"Well" drop down: Use to add to the selection or replace the selection
"Show Geosteer TYPE" button: Shows or hides surveys for all Type wells used in the current geosteering interpretation
Geosteering Type Wells are defined in the Geosteering Settings
"Show Wells with Formation" dropdown: Select a Formation from the list to show all wells that have a geosteering interpretation using that formation as a target
Tops: Refine by wells with formation tops
Well: Refine by wells with target formation
Geosteer: Refine by wells that have a geosteering target formation
"Show Nearby" button: Select wells within a defined buffer of the Active Well
"Lateral Only" checkbox: When checked on, ZoneVu will only use the lateral portion of the Active Well to search for nearby wells
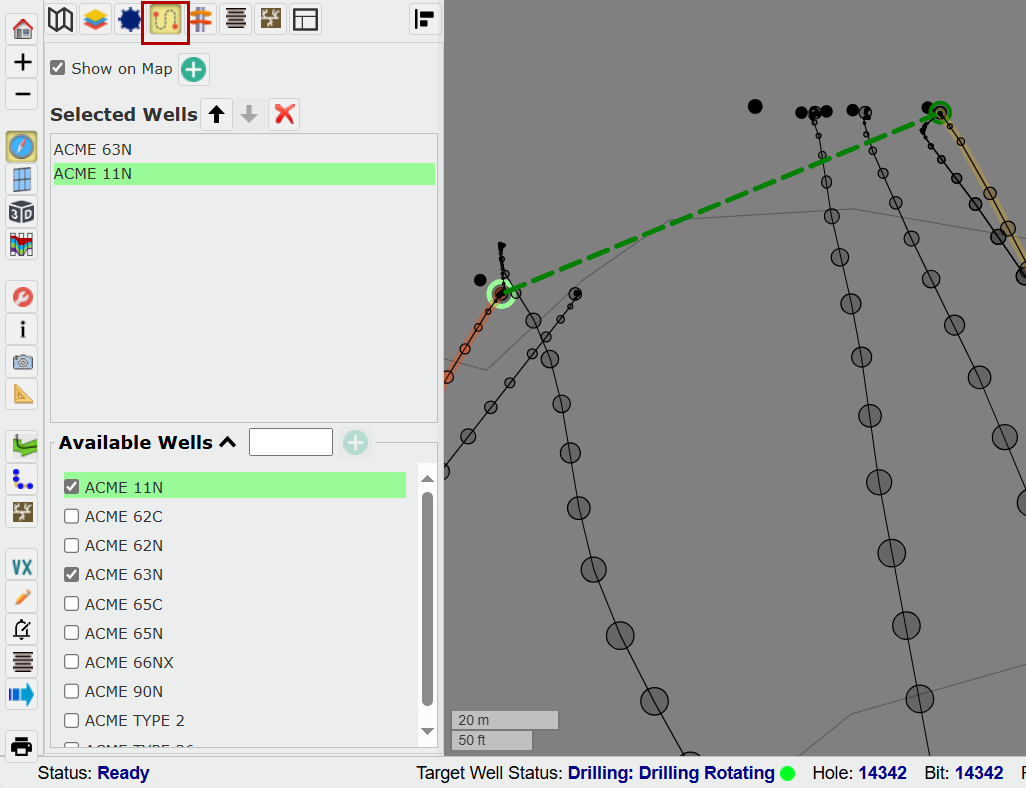
Correlation Panel Tab:
The Correlation tab controls the display of Log Correlation Wellbores for selected wells in the Viewer
"Show on Map" checkbox: Displays the correlation panel line on the map with a green dashed line
Available Wells: First, select Available Wells from the list at the bottom by clicking the checkboxes
You can filter this list by typing a letter or number in the field provided
Selected Wells: To adjust the position of the well, click the name and then click the Up or Down arrow. Click the X icon to de-select the well
"Plus sign": Click to add wells clicked on map to strat section
If you click on the well name, it will highlight in green on the list and in the Viewer
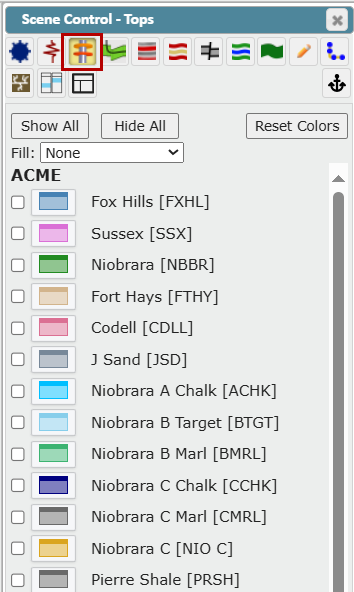
Tops Tab:
The Tops tab shows all the top data associated with the project
Use the checkboxes to make one or more Top(s) visible on every visible well with data for that Top
Use the "Show All" or "Hide All" button to show or hide all available Top(s)
"Reset Colors" button: Reset the Top(s) display colors to the default color(s) defined in the related Start Column
Use the "Fill" dropdown to select color and texture options
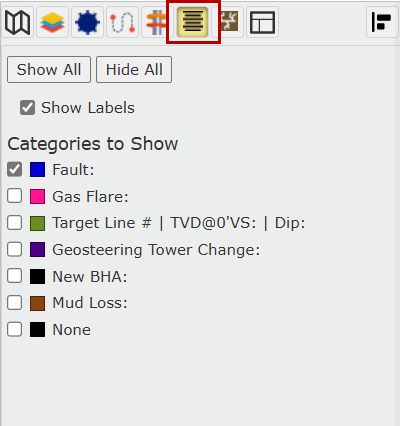
Wellbore Notes Tab:
The Tops tab shows all the wellbore notes (User Notes and Rig Notes) associated with the project
Related article: https://help.ubiterra.com/help/creating-user-notes-in-zonevu
Use the checkboxes to show wellbore note categories
Use the "Show All" or "Hide All" button to show or hide all available Wellbore Notes
Use the "Show Labels" checkbox to display the category along with the note
Fracs Tab:
This tab allows you to turn on Fracs and control their appearance.
Use the icons at the top of the list to expand or collapse the folders
Use the On/Off checkboxes to make one or more Frac Plans visible
Use the "Hide" button to hide all available Fracs
Use the "Show Fracs" dropdown to select the option to show starred Fracs, Frac Plans, or Frac Jobs
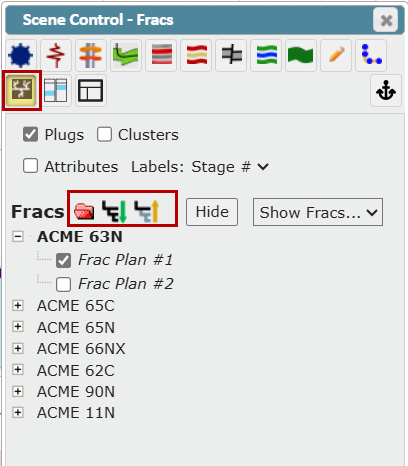
Use the "Plugs" checkbox to display Plugs
Use the "Clusters" checkbox to display Clusters
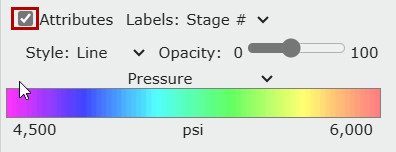
Use the "Attributes" checkbox to see options that control the appearance of the Frac
Select a Stage from the "Labels" dropdown (Stage # or Attribute)
Use the "Style" dropdown to select Line or Bubble style
Use the "Opacity" slider to control the opacity
Use the Attribute dropdown to select from a list including Pressure, ScreenedOut, Slurry Rate, etc...
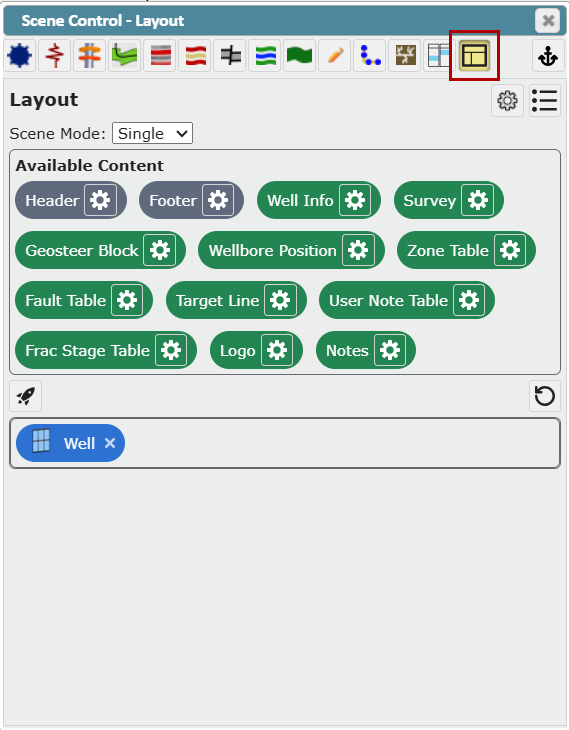
Layout Tab:
The Layout tab in Scene Control allows you to create a custom layout or tabbed layout. In these Layouts, you can dock multiple viewers or data widgets to create the custom displays. Click here to go to the Help article
Layout Tab How-To Article: Creating a Custom Viewer Layout